Monthly Archives: October 2022

What in the world is a Kernel!?

I attended the workshop “Git It: Intro to Git and GitHub” taught by Nicole Cote. It was super helpful. Below is the process and reflection about it.

Figure 1. Screenshot of the download process of Git. “What in the world is a Kernel?“. The first thing we needed to do to complete the workshop was, of course, to download Git and create a free account on Github. I stumble upon many troubles and questions, specially regarding terminology.

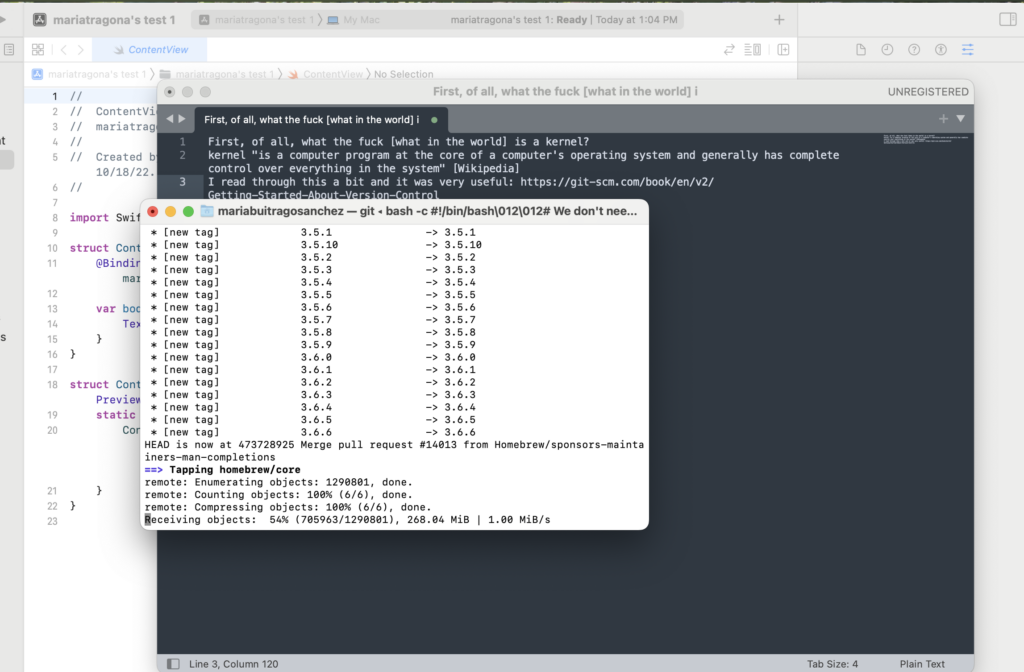
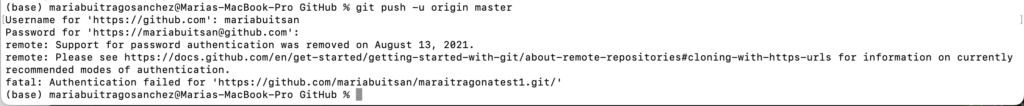
The first steps with Git and Github are, of course, to download the program and create an account on Github. However, to be able to interact with the program and with the local versions of your files you previously need to have installed a coding program like Sublime, Virtual Studio Code or Xcode. Then, you need to select a way to download Git, there are several options, I tried (for reasons unknown to myself) several. In the end I did the homebrew option and ran it through my terminal. Then, the program kind of just goes on its own. It was all very confusing and intimidating at first so I had to watch several videos on how to do it. The most useful one was this one. The guy goes straight to the point (unlike so many others!) and even helps you setting up a ‘Personal Access Token’ without which I just couldn’t do anything on my Mac (again, who knows why).

Once able to download everything you’ll need to connect the local files with the repository you created online, or rather vice versa. Nicole walked us through how to do this step by step, which is sort of easy. You just create a new repository on Github and copy the URL of the ‘README’ file into your terminal. The repository has a specific or, rather, a basic structure so, at least to my understanding, there will always be a “README” file. But you paste the URL of the ‘README’ only once you’ve configured your git name and email on your terminal. Nicole also explained the most important and basic terminology that we absolutely need in order to create the communication path between local files and Github. She explained terms like ‘repository‘ which I understood as another word for where you save all the files of a project or simply a ‘folder‘; also terms like ‘Fork‘, ‘Branch‘, ‘Pull Request‘ and ‘Issue‘.

Figure 2. Screenshot of another issue that reads: “Fatal: Authentication failed for …” which was resolved creating a ‘Personal Access Token’ but I don’t know why.

After reviewing the terms, we started our own test repository and try some Git Commands. I had to repeat this several times on my own until I actually could do it with some ease. And then, I started to make changes to the file on my computer and pushing the changes to Github repeating the following commands like a mantra: “git status/ git add README.md/ git add –all/ git commit -m “new” and so forth and so on, again and again and again. However, I must say that Git tends to tell you all the time and suggest to you if you’ve done wrong something or if the command has any typo, and tells you a possible option or solution, which helps a ton. I also read some of the material available on Git to understand Git, which you can find here. And also used this guide for the basic elements of Markdown files.

Figure 3. Screenshot of the README.md file that I continuously pushed to GitHub, but one can also just edit directly in GitHub.

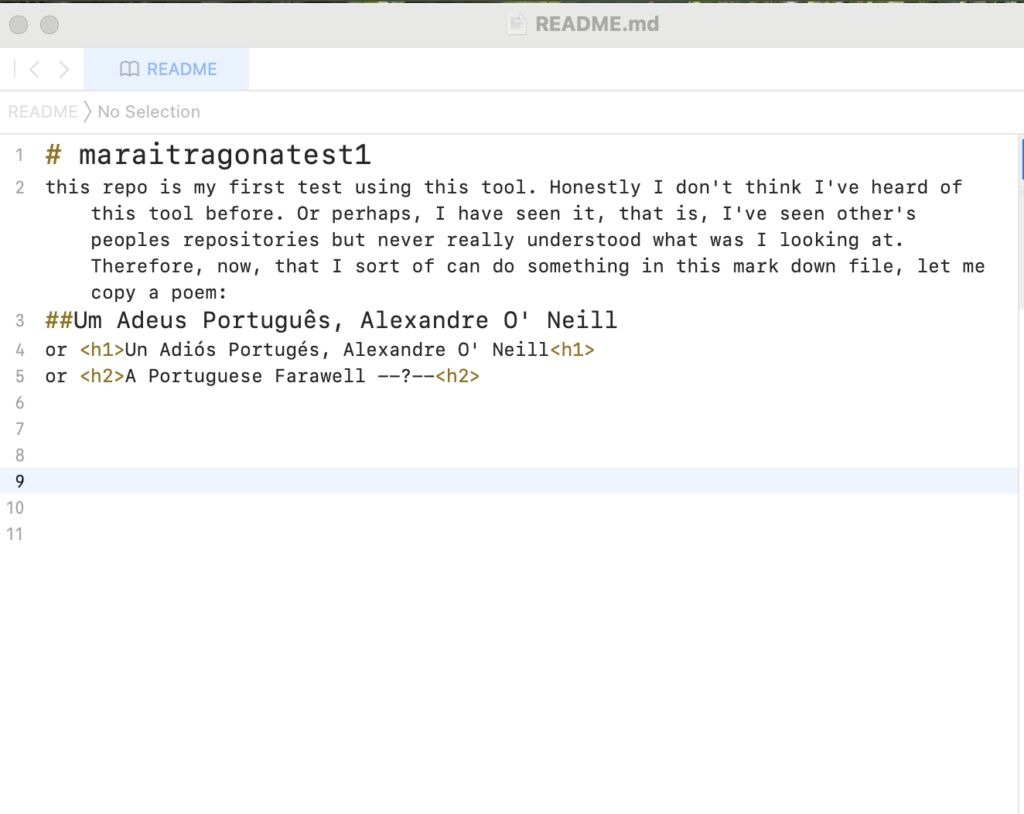
I decided to copy/past/interact with a poem just because, and ended with this README.md file on the test repo. After trying GitHub I do think is a great tool to track the multiple changes one does to a file/project, and is especially helpful if many people are collaborating at the same time. One thing I found very interesting is that the way the tool is built allows for collaboration that could be more horizontally oriented, so everyone can share their edits/opinions on a given project and all, at least in theory, are deemed equally important. Another feature is that other people can interact with your repo and raise an issue about changes they would like to suggest, furthermore they can clone your repo to start a similar project on their own. Thus, seems like knowledge shared on GitHub can be spread widely to different audiences rather than if you just store your projects or files in other places/websites/digital spaces where no one can comment or alter. I absolutely learned a lot through this process, for example now I have a basic idea of what’s the difference between a ‘Centralized Control System’ vs a ‘Distributed Version Control System’ like GitHub. And, honestly, I’m not sure anymore how I stumble upon the word kernel…maybe is just my plain ignorance but I was never ever introduce to any of this vocabulary. Which is terrible. This tool made me realize (again) how far the people that graduated from the humanities, like me, are to this terms. And that is so unjust and irritating if we consider how key this vocabulary is to understand the mechanisms by which our current world functions. And to realize (again) how compartmentalized our disciplines are is kind of sad; each creates its own set of terms and sophisticated vocabulary that ends up being nothing but a condense and rigid wall through which none but the ‘experts’ can penetrate and have a say.

Figure 4. Screenshot of the different versions of the file in GitHub

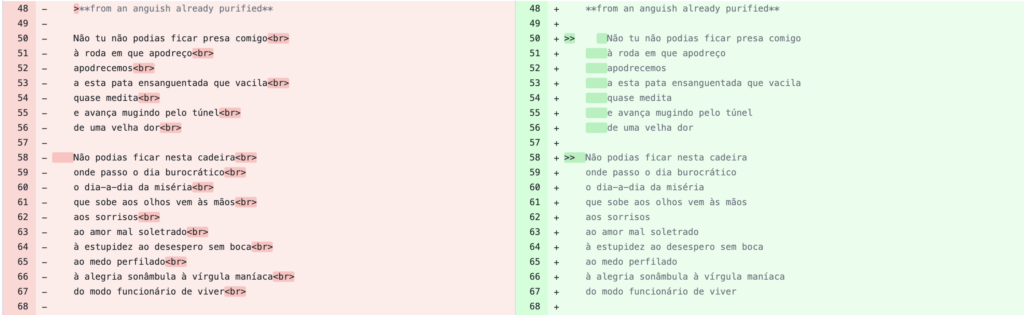
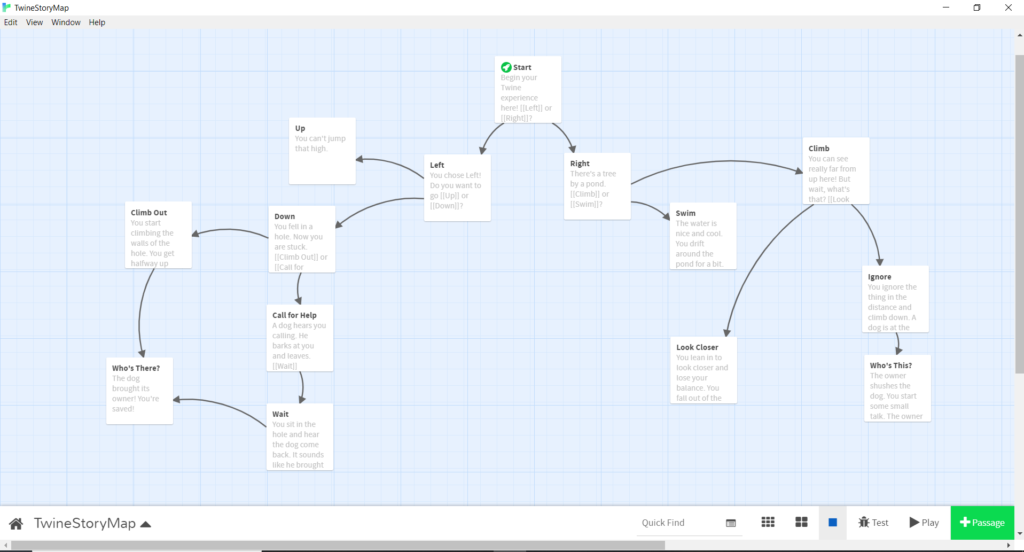
Anyways, it was fun to see how in fact you actually can review side by side (figure 4), track, and go back to previous versions of your files. While copying the poem I realized how great it would be for translators and creators to have different version of a same literary work, to be able to branch a file to create multiple word choices and have others comment on it or if there’s a work of fiction to have different passages and compare them side by side, seems so cool, at least in theory.

There’s so much more to learn and so much that I still don’t understand. So many questions.

Student Digital Portfolios on CUNY Academic Commons

Today, I attended the workshop lead by Anthony Wheeler, Commons Community Facilitator along with Prof Tom Peele, Director of FYW City College and Stefano Morello, CCNY Digital Fellow. The workshop was recorded and I believe will be shared on the Commons, I was one of only 2 attendees and have permission from Anthony to share the recording below with our class. I am still figuring out the incredible amount of information and platforms that I have been exposed to in the past 2 months and this workshop was super helpful in understanding a bit about the Academic Commons and what it offers in regards to student portfolios. Anthony also shared some portfolio links that I have included below.

Enjoy!

Raffi Khatchadourian: https://khatchad.commons.gc.cuny.edu/

Jojo Karlin: https://jojokarlin.commons.gc.cuny.edu/

Christina Shamrock: https://cshamrock.commons.gc.cuny.edu/

Christina Katapodis: https://christinakatopodis.com/ (not on the Commons but also built in WordPress)

The recording link to the workshop:

https://gc-cuny-edu.zoom.us/rec/play/_WqYb0TdMVLMkNzr-j_T1JL9UzvMT14bVLTgNrfzFVbpXjQigWanze2U9GCAnX1eBJVsYzAEYDBqSi9p.thIuddGZQvzRvWoC?continueMode=true&_x_zm_rtaid=QPFkE1vzSo6N3RRM-PmW3w.1666119602110.98e80827d7187f9da883b69507c292b5&_x_zm_rhtaid=371

Worldwide Refugees in 2021

My mapping assignment has been a winding road passing many villages of programs to get to the goal of a map. When I first thought about the assignment, my first idea was to think of mapping the immigrant community in NYC by zip code with layers of supermarkets in each zip code with layers of farmers markets and community gardens in each area as well. The idea was to show the preponderance of food deserts. I started my journey by going to QGIS which I understood to be the standard. After an hour with the program, I realized that the learning curve was too steep for me. I went over to Google Maps, which was unappealing. I finally settled on Tableau. After watching about 6 YouTube videos on learning the basics, I felt I had an idea on how to proceed. I started looking for datasets to input or connect to Tableau. I ran into some issues as to finding the datasets I was looking for. Finding the data was challenging as there wasn’t one place for me to gather what I was looking for, so I decided to go to the UN as it was one location that was organized. I changed my topic to the number of refugees worldwide and downloaded datasets about that. The dataset was overwhelming as it spanned years and had a very large subset of categories. I tried to work with what I had but ran into many issues. I even stripped the data to only include one year but still got stuck on how to proceed. This is when I reached out to Filipa who was extremely helpful and patient. She said she would learn Tableau to help me out! Something I said would not be really necessary as I can ask for another tutor, but she did it anyway. Not only that, but she went to the UN site and retrieved a dataset that was much more different than mine. What she showed me was that my original dataset was incomplete in some ways and too much in other ways. She also showed me how to be extremely selective in choosing the dataset for mapping. From there, she helped me to fine tune the map I started with. This became the present map that I share with the class. It is a map, actually 3, of refugees in the world in 2021: 1 is the total number in each country; one is the number of females 5-11 years old; one is the total number of males 5-11 years old; and the last one is the total number of all refugees. It was exciting to finally get a finished project. Although it may be finished for the assignment, I’m intrigued to see how I can add one or 2 more layers to the map. Perhaps the number of organizations helping in each country or the number of asylum seekers that are accepted in each country from the refugee pool or the average number of years that each has been a refugee. This is a strong skill to have acquired. I easily can see so many possibilities for it.

OA and MC

This weeks readings centered around Open Access Publishing/ Minimal Computing / Digital Scholarship lead me down a path (or rabbit hole:-) where I ended up focusing and thinking about open access and minimal computing as we head towards a decentralized version of the internet.

Risam, Roopika and Gil, Alex. “Introduction: The Questions of Minimal Computing.” Digital Humanities Quarterly Vol 16.2 (2022).

When we speak of knowledge production, we no longer speak simply of the production of documents. We include the production of data, data sets, and documents as data, all of which can be used for algorithmic analysis or manipulation. The issue of control over data sets, especially those that can inform the pasts of whole demographics of people in the world, will certainly come to a head in the 21st century. One example of danger is control over Black data. At the moment of writing, the vast majority of the data and documents that help us understand the history of Black people during the period of Atlantic chattel slavery are controlled by predominantly white scholarly teams and library administrators or white-owned vendors.[15] This demonstrates how access to infrastructure has direct consequences on our study and reconstruction of the past and, by extension, what we understand that past to be. While data reparations must be made, our interest here is in the role that minimal computing can play in the development of present and future data sets, documents as data, and methods that promote collaboration and interoperability among colleagues around the world by not only taking into account uneven distribution of resources and the constraints with which the majority are contending but also by ensuring that control over the production of knowledge is in their hands.

In the article minimal computing the authors touch on previous discussions and articles we have read in class about the creation, curation and control over datasets by those the data and histories are about.

The importance of collaboration and representation in data and information goes beyond academia and scholarly works. I read an article today about a database of beauty products, made and sold by Black-owned companies and are free of toxic chemicals linked to health concerns that disproportionately impact Black women. Although this is not under the umbrella of DH, it is part of a bigger journey and mindset that aligns with DH values.  

Suber, Peter. 2012. “What Is Open Access?” In Open Access (1st ed.). MIT Press.

We’d have less knowledge, less academic freedom, and less OA if researchers worked for royalties and made their research articles into commodities rather than gifts. It should be no surprise, then, that more and more funding agencies and universities are adopting strong OA policies. Their mission to advance research leads them directly to logic of OA: With a few exceptions, such as classified
research, research that is worth funding or facilitating is worth sharing with everyone who can make use of it.

Open access and freely sharing research and information to help us understand ourselves, others and the world is a foundational aspect of DH. I started thinking and reading more about this topic in a broader sense and how open access has and will shape our experiences. I wondered about what open access with the onset of web3 looks like and found some sites that are interesting and read an article about what web3 could mean for education.

https://www.edsurge.com/news/2022-01-24-what-could-web3-mean-for-education

Sharing some of the sites I found interesting-

https://lib-static.github.io/models/wax/ Wax is an extensible workflow for producing scholarly exhibitions with minimal computing principles.

https://www.buildinpublic.xyz  Learn how to build an audience by building in public.

https://okfn.org  Our mission: an open world, where all non-personal information is open, free for everyone to use, build on and share; and creators and innovators are fairly recognised and rewarded.

https://www.fwb.help Our Vision: We believe that Web3 has the potential to empower creators, connect individuals with global communities, and distribute knowledge and shared resources. Through our collective efforts, we hope to shape a future in which technology acts as a communal connective tissue. The tools to make this world a reality are finally here, and we’re excited to use them to create more fluidity, transparency, and resiliency in how we think and work together.

https://www.k20educators.com Vision :k20 was created to connect educators from around the world in order to realize our collective brilliance. When educators collaborate, we’re able to transcend local obstacles to produce global solutions. And if educators are expected to change the world, we should have access to the world’s best professional learning to optimize our impact. k20 aims to be the largest networking, learning, and career hub for educators, with the most comprehensive directory of professional learning. We are enabling knowledge sharing to dismantle global silos in education.

https://www.merlot.org/merlot/ The MERLOT system provides access to curated online learning and support materials and content creation tools, led by an international community of educators, learners and researchers.

Workshop Review: Text Analysis with Natural Language Toolkit (NLTK)

On Friday I attended the GCDI Digital Fellow’s workshop Text Analysis with Natural Language Toolkit (NLTK), the function of which the program instructor described as “turning qualitative texts into quantitative objects.” As a complete neophyte to both the Python programming language that NLTK runs on as well as to text analysis, I was eager to assess how easily a newcomer like myself could learn to use such a suite of tools, as well as to continue thinking about how the fruits of such textual quantification might contribute to the meaningful study of texts. 

The workshop, which required download of the Anaconda Navigator interface to launch Jupyter notebook, was very useful in introducing and putting into practice core concepts for cleaning and analyzing textual data as expressed in different commands. The “cleaning” concepts included text normalization (the process of taking a list of words and transforming it into a more uniform sequence), the elimination of stopwords (terms like articles that appear frequently in a language, often adding grammatical structure but contributing little semantic content), and stemming and lemmatization (processes that try to consolidate words based on their root and grouping inflected forms of a principal word respectively). 

The introductory file library that we analyzed in the workshop included nine texts, among them Herman Mellvile’s Moby Dick, Jane Austen’s Sense and Sensibility, and the King James Version/Authorized Version text of the biblical Book of Genesis. As one would expect, the command text.concordance“(word)” collates all instances of a term’s occurrence within one text. The command text.similar“(word)” seems especially useful: this command ranks words that occur in the same context as the primary term being investigated. Such quantitative ranking of contextually-related terms seems to get closer to the heart of the humanities’ first and last endeavor: the qualitative interpretation of meaning.

When we were reviewing the different visualizations NLTK could generate, I suggested the following command for Genesis (modified, since the workshop, to include the word ‘LORD’, since the KJV translation of Genesis typically uses ‘LORD’ to render the tetragrammaton ‘YHWH,’ whereas ‘God,’ is employed to render ‘Elohim’; I also added ‘Adam’, ‘Noah’, and Jacob’s alias, ‘Israel’, for good measure) :

text3.dispersion_plot([“God”, “LORD”, “Adam”, “Noah”, “Abraham”, “Isaac”, “Jacob”, “Israel”, “Joseph”])

As one would expect, the resulting visualization conveys a sense of the narrative arc of Genesis based on the lives of the patriarchs as identified by their proper nouns. In demonstrating the narrative relationship between different personages, a visualization of this sort could possibly be useful in the same way as To see or Not to See, the Shakespeare visualization tool demonstrated by Maria Baker several weeks ago. 

Text Analysis with NLTK Workshop

I attended the Introduction to NLTK (Text Analysis) with Python workshop this last Friday. The workshop was overall very useful, and helps you get started with the right suite of tools to start conducting some basic exploratory analysis on text data.

The workshop asked users to download Jupyter Notebook. I already had this installed as part of Anaconda Navigator, and had used it in a previous class. I find Jupiter notebook to be a great user-friendly tool to work and learn Python with! 

We imported the NLTK Library and the matplotlib for data visualization in the notebook. Using the capabilities of these libraries and magic functions, the instructor showed us how to do some basic plotting and text analyses, such as calculating lexical density, frequency distributions of certain words, and dispersion plots.

Some of these commands are case sensitive, so the instructor taught us how to make all words lowercase to allow for proper counts. We went through the process of cleaning the data, with lemmitization and stemming, as well as removing stop words.

The steps we used are described in the code below. For this blog post, I decided to re-do the workshop assignment with looking at the The Book of Genesis instead of Moby Dick, which we used in the workshop.

import nltk

In [2]:

#for dispersion plot, #to tell Jupyter notebook to display the graph in the notebook
import matplotlib 
%matplotlib inline 

In [3]:

nltk.download()
showing info https://raw.githubusercontent.com/nltk/nltk_data/gh-pages/index.xml

Out[3]:

True

In [4]:

from nltk.book import *
*** Introductory Examples for the NLTK Book ***
Loading text1, ..., text9 and sent1, ..., sent9
Type the name of the text or sentence to view it.
Type: 'texts()' or 'sents()' to list the materials.
text1: Moby Dick by Herman Melville 1851
text2: Sense and Sensibility by Jane Austen 1811
text3: The Book of Genesis
text4: Inaugural Address Corpus
text5: Chat Corpus
text6: Monty Python and the Holy Grail
text7: Wall Street Journal
text8: Personals Corpus
text9: The Man Who Was Thursday by G . K . Chesterton 1908

In [5]:

type(text3)

Out[5]:

nltk.text.Text

In [6]:

text3.concordance("whale")
no matches

In [7]:

text3.similar("life")
house name brother cattle blood son fowls money thigh god heaven it
good land fruit fowl beast lord sight knowledge

In [8]:

text3.similar("love")
went drank earth darkness morning se them give nig hath man had thus
not took keep die call sle woman

In [9]:

text3.similar("queer")
No matches

In [10]:

text3.similar("death")
face place cattle image host generations sight father mother wife eyes
voice presence head children hand way brother sheep flock

In [11]:

text3.dispersion_plot(["life","love","loss","death"]) #the following graph shows where the word appears based on the number of words or pages in. e.g. between 0 and 250000 

In [12]:

text3.count("Love")

Out[12]:

0

In [13]:

text3.count("love")

Out[13]:

4

In [14]:

text3_lower = []
for t in text3:
    if t.isalpha():
        t = t.lower()
        text3_lower.append(t)

In [15]:

from nltk.corpus import stopwords

In [16]:

stops = stopwords.words('english')

In [17]:

print(stops)
['i', 'me', 'my', 'myself', 'we', 'our', 'ours', 'ourselves', 'you', "you're", "you've", "you'll", "you'd", 'your', 'yours', 'yourself', 'yourselves', 'he', 'him', 'his', 'himself', 'she', "she's", 'her', 'hers', 'herself', 'it', "it's", 'its', 'itself', 'they', 'them', 'their', 'theirs', 'themselves', 'what', 'which', 'who', 'whom', 'this', 'that', "that'll", 'these', 'those', 'am', 'is', 'are', 'was', 'were', 'be', 'been', 'being', 'have', 'has', 'had', 'having', 'do', 'does', 'did', 'doing', 'a', 'an', 'the', 'and', 'but', 'if', 'or', 'because', 'as', 'until', 'while', 'of', 'at', 'by', 'for', 'with', 'about', 'against', 'between', 'into', 'through', 'during', 'before', 'after', 'above', 'below', 'to', 'from', 'up', 'down', 'in', 'out', 'on', 'off', 'over', 'under', 'again', 'further', 'then', 'once', 'here', 'there', 'when', 'where', 'why', 'how', 'all', 'any', 'both', 'each', 'few', 'more', 'most', 'other', 'some', 'such', 'no', 'nor', 'not', 'only', 'own', 'same', 'so', 'than', 'too', 'very', 's', 't', 'can', 'will', 'just', 'don', "don't", 'should', "should've", 'now', 'd', 'll', 'm', 'o', 're', 've', 'y', 'ain', 'aren', "aren't", 'couldn', "couldn't", 'didn', "didn't", 'doesn', "doesn't", 'hadn', "hadn't", 'hasn', "hasn't", 'haven', "haven't", 'isn', "isn't", 'ma', 'mightn', "mightn't", 'mustn', "mustn't", 'needn', "needn't", 'shan', "shan't", 'shouldn', "shouldn't", 'wasn', "wasn't", 'weren', "weren't", 'won', "won't", 'wouldn', "wouldn't"]

In [18]:

text3_stops = []
for t in text3_lower:
        if t not in stops:
            text3_stops.append(t)

In [19]:

print(text3_stops[:30])
['beginning', 'god', 'created', 'heaven', 'earth', 'earth', 'without', 'form', 'void', 'darkness', 'upon', 'face', 'deep', 'spirit', 'god', 'moved', 'upon', 'face', 'waters', 'god', 'said', 'let', 'light', 'light', 'god', 'saw', 'light', 'good', 'god', 'divided']

In [20]:

len(set(text3_stops)) #to see how many unique stopwords there are use set()

Out[20]:

2495

In [21]:

# lemmatization to take the root word
from nltk.stem import WordNetLemmatizer

In [22]:

wordnet_lemmatizer = WordNetLemmatizer()

In [23]:

wordnet_lemmatizer.lemmatize("waters")

Out[23]:

'water'

In [24]:

# create clean lemmatized list of text 3
text3_clean = []
for t in text3_stops:
    t_lem = wordnet_lemmatizer.lemmatize(t)
    text3_clean.append(t_lem)

In [25]:

print(len(text3_clean))
18335

In [27]:

#lexical density
len(set(text3_clean)) / len(text3_clean)

Out[27]:

0.12838832833378783

In [28]:

#sorting the first 30 unique 'cleaned' words of the text 
sorted(set(text3_clean))[:30]

Out[28]:

['abated',
 'abel',
 'abelmizraim',
 'abidah',
 'abide',
 'abimael',
 'abimelech',
 'able',
 'abode',
 'abomination',
 'abr',
 'abrah',
 'abraham',
 'abram',
 'abroad',
 'absent',
 'abundantly',
 'accad',
 'accept',
 'accepted',
 'according',
 'achbor',
 'acknowledged',
 'activity',
 'adah',
 'adam',
 'adbeel',
 'add',
 'adder',
 'admah']

In [30]:

#Stemming is the process of reducing a word to its word stem that affixes to suffixes and prefixes or to the roots of words known as a lemma.
from nltk.stem import PorterStemmer
porter_stemmer = PorterStemmer() 

In [31]:

print(porter_stemmer.stem('accept'))
print(porter_stemmer.stem('accepted'))
accept
accept

In [32]:

t3_porter = []
for t in text3_clean:
    t_stemmed = porter_stemmer.stem(t)
    t3_porter.append(t_stemmed)

In [33]:

print(len(set(t3_porter)))
print(sorted(set(t3_porter))[:30])
2113
['abat', 'abel', 'abelmizraim', 'abid', 'abidah', 'abimael', 'abimelech', 'abl', 'abod', 'abomin', 'abr', 'abrah', 'abraham', 'abram', 'abroad', 'absent', 'abundantli', 'accad', 'accept', 'accord', 'achbor', 'acknowledg', 'activ', 'adah', 'adam', 'adbeel', 'add', 'adder', 'admah', 'adullamit']

In [34]:

my_dist = FreqDist(text3_clean)

In [35]:

type(my_dist)

Out[35]:

nltk.probability.FreqDist

In [36]:

my_dist.plot(20)

Out[36]:

<AxesSubplot:xlabel='Samples', ylabel='Counts'>

In [37]:

my_dist.most_common(20)

Out[37]:

[('unto', 598),
 ('said', 477),
 ('son', 294),
 ('thou', 284),
 ('thy', 278),
 ('shall', 259),
 ('thee', 257),
 ('god', 236),
 ('lord', 208),
 ('father', 207),
 ('land', 189),
 ('jacob', 179),
 ('came', 177),
 ('brother', 171),
 ('joseph', 157),
 ('upon', 140),
 ('day', 133),
 ('abraham', 129),
 ('wife', 126),
 ('behold', 118)]

In [ ]:


GCDI Digital Fellows: Text Analysis with NLTK

On Friday, the GCDI Digital Fellows hosted a workshop on how to use online libraries and programming languages for text analysis purposes. The session revolved around Python and its Natural Language Tool Kit (NLTK), an inbuilt platform that specifically works with human language data. NLTK allows the conversion of texts, such as books, essays and documents, into digitally consumable data, which implies a transformation of qualitative contents into quantitative, and therefore decomposable and countable, items. The workshop did not require prior experience with NLTK and resulted in an extremely effective session.

I thought of different ways of summarising what was covered during the seminar in a way that other people would find useful and decided to write a step-by-step guide that incapsulates the main aspects discussed and some additional pieces of information that can be helpful when approaching Python and Jupyter Notebook from scratch.

Required downloads/installations

  • A Text Editor (aka where the user writes their code) of your choice, I opted for Visual Studio Code, alternatively Notepad would do – FYI: Google Docs & Microsoft Word will not work since they are not text editors, but word processors;
  • Anaconda;
  • Git for Windows , for Windows users only. This is optional, but I would still recommend it.

About Python

  • There is extensive documentation available, including the official Beginner’s Guides.
  • It is an interpreted language, hence it does what the user tells it to.
  • It is object-oriented; mostly Python has ‘classes’ of objects, and almost everything is an object.
  • Python is designed to be readable.

Jupyter Notebook

Jupyter Notebook is structured data that represents the user’s code, metadata, content, and outputs. When saved to disk, the notebook uses the extension .ipynb, and uses a JSON structure. Jupyter Notebook and its interface extend the notebook beyond code to visualisation, multimedia, collaboration, and more. In addition to running codes, it stores code and output, together with markdown notes, in an editable document called a notebook. When saving it, this is sent from the user’s browser to the notebook server which, in turn, saves it on disk as a JSON file with a .ipynb extension.

Remember: do save each new file/notebook with a name, otherwise it will be saved as “unnamed file”. You can type in your search bar Jupyter and see if it is already installed on your computer, otherwise you can click > Home Page – Select or create a notebook

When ready, you can try the below steps in your Jupyter Notebook and see if they produce the expected result/s. To comment in Jupyter you can use the dropdown menu selecting “markdown” instead of “code”. Alternatively, you can use either 1 or 2 # signs.

In Jupyter every line can be a code, or a comment, and each line can be run independently – also, lines can be amended and rerun.

To start type these commands in your Jupyter Notebook (commands are marked by a bullet point and comments follow in Italic):

  • import nltk
    • nltk stands for natural language tool kit
  • from nltk.book import *
    • the star means “import everything”
  • text1[:20]
    • for your reference: text1 is Moby Dick
    • this command prompts the first 20 items of the text
  • text1.concordance(‘whale’) 
    • Concordance is a method that shows the first 25 occurrences of the word whale together with some words before and after – so the user can understand the context – this method is not case sensitive

Before proceeding, let’s briefly look at matplotlib.

What is matplotlib inline in python

IPython provides a collection of several predefined functions called magic functions, which can be used and called by command-line style syntax. There are two types of magic functions, line-oriented and cell-oriented. For the purpose of text analysis, let’s look at %matplotlib, which is a line-oriented magic function. Line-oriented magic functions (also called line magics) start with a percentage sign (%) followed by the arguments in the rest of the line without any quotes or parentheses. These functions return some results, hence can be stored by writing it on the right-hand side of an assignment statement. Some line magics: %alias, %autowait, %colors, %conda, %config, %debug, %env, %load, %macro, %matplotlib, %notebook, etc.

  • import matplotlib
  • %matplotlib inline

Remember that Jupyter notebooks can handle images, hence plots and graphs will be shown right in the notebook, after the command.

  • text1.dispersion_plot([‘whale’, ‘monster’])
  • text1.count(‘whale’)
    • this command counts the requested word (or string) and is case sensitive – so searching for Whale or whale DOES make a difference.

As the count command is case sensitive, it is important to find a way to lower all words first and then count them accordingly. See below a new list made of lowered words. We can call the new list text1_tokens = []

  • text1_tokens = []
  • for word in text1:
    • if word.isalpha():
      • text1_tokens.append(word.lower())

It is now possible to quickly check the new list by using the following command.

  • text1_tokens[:10]

The next step would be to count again; this time the result will be made of ‘whale’ + ‘Whale’ + any other combination of the word whale (i.e. ‘WhaLE’).

  • text1_tokens.count(‘whale’)

Further to the above, it is possible to calculate the text’s lexical density. Lexical density represents the number of unique (or distinct) words over the total number of words. How to calculate it:  len(set(list)/len(list) the function ‘set’ returns a list containing only distinct words. To exemplify:

  • numbers = [1, 3, 2, 5, 2, 1, 4, 3, 1]
  • set(numbers)

The output should look like the following: {1, 2, 3, 4, 5}

Let’s use this on text 1 now. The first step requires to check the unique words in the newly created ‘lowered list’. Then, the next command asks the computer to spit out only the number of unique words, and not to show the full list. Finally, it is possible to compute the ratio of unique words over total of words.

  • set(text1_tokens)
  • len(set(text1_tokens))
  • len(set(text1_tokens)) / len(text1_tokens)

Let’s slice it now and create a list of the first 10,000 words. This allows to compare, for example, the ratio of text1 to the ratio of text2. Remember, it is very dangerous to draw conclusions based on such a simplified comparison exercise. The latter should be taken as a starting point to generate questions and provide an insightful base to work on more a complex text analysis instead.

  • t1_slice = text1_tokens[:10000]
  • len(t1_slice)
  • len(set(t1_slice))/10000
  • t2 = [word.lower() for word in text2 if word.isalpha()]
  • t2_slice = t2[:10000]
  • len(set(t2_slice))/10000

Minimal Computing

Every sector publishes information on websites and online portals to inform their particular audience about problems they may encounter and present pathways to potential solutions. For instance, in the medical/health sector there are sites like WebMD and Mayo Clinic, and in the legal/justice sector there are sites like LawHelpNY and Crime Victims Legal Help. These sites speak to a range of individuals, from advocates who use it to help their clients to people in need who have vastly different reading levels and internet access. This brings me to the article, Introduction: The Questions of Minimal Computing where we’re warned that “defining minimal computing is as quixotic a task as defining digital humanities itself,” but can generally be considered to mean “a mode of thinking about digital humanities praxis that resists the idea that “innovation” is defined by newness, scale, or scope,” in response to, or consideration of, constraints such as the “lack of access to hardware or software, network capacity, technical education, or even a reliable power grid.” 

I’m considering the possibility of exploring this topic more broadly for my final paper, but will focus my notes for this post on minimal computing as it relates to digital humanities projects. First, the authors recommend that considering the constraints when developing a digital humanities project we should ask 4 constituent questions:  1) “what do we need?”; 2) “what do we have”; 3) “what must we prioritize?”; and 4) “what are we willing to give up?” As someone who has project-managed product development in the nonprofit sector over the past few years, this is a good framework for projects beyond the confines of digital humanities projects. A north star which the author’s point to and which resonates is “sometimes — perhaps often — when we pause to consider what we actually need to complete a project, the answer isn’t access to the latest and greatest but the tried and true.”

To implement minimal computing in digital humanities projects, we must sit with the following tensions: the impulse towards larger, faster, always-on forms of computing, the consideration of the range of computer literacy of the intended audience, and the tension between choice and necessity driven by the dearth of funding and resources.

Workshop: Finding Data for Research Projects

Early in the semester we had an assignment that involved finding a data set and offering analysis. There are several ways to go about doing this including a simple internet search for “data sets for research projects” or identifying an area of interest and looking for related data. Another great option I discovered is the Graduate Center Mina Rees Library’s Finding Data portal. The following is a brief overview.

The home page of the portal offers general information along with pathways for 5 categories of data:

  1. Demography & Populations
  2. Education & Housing
  3. Labor & Economics
  4. Health & Environment
  5. Law, Politics & Conflict

There are also guides for analyzing and visualizing data and mapping data. If it all seems a bit overwhelming, a “where to start” section on the home page offers examples of local data such as NYC OpenData and Neighborhood Data Portal, national data such as American FactFinder, and international data such as UNdata. 

There are some limitations, however. I was interested in the Law, Politics & Conflict data sets, and specifically about data related to 2 areas: access to civil justice and American democracy. There were a few data sets related to criminal justice but none for civil justice which is admittedly not as widely studied, and there were no data sets for American democracy. Still, if you don’t have a specific area of interest and looking for a place to discover data sets that you can use for projects, the Mina Rees Library’s Finding Data portal is a great resource.

Reflections about Workshop in interactive storytelling

I attended a workshop about interactive storytelling with the program Twine and I wanna share some of my takeaways.  

Twine is a free and open-source tool for making interactive fiction in the form of web pages. You don’t need to write any code to create a story with Twine, but you can extend your stories with variables, conditional logic, images, CSS, and JavaScript. The goal of the workshop was to get familiar with the program and try to create your own interactive storytelling. The setup was that each person participated online from their own computer and was connected to an online program that took you through the different steps of using twine. Twine works as a grid of paths where at each step you will have to pick your next step.

This is an example of a storyline. 

The workshop started with a video that explained the basic tools followed by time for each person to start creating their own stories. Every 15 min. you would then be matched up with another participant to try their game, give feedback and resume again to your own story. I think the idea of the setup was great. Unfortunately the workshop encountered many technical issues which resulted in I never got to try another participant’s game. Nevertheless I still learned the basics of the program and had some takeaways. 

  • It is an easy program to get started with and uses very simple coding tools. I got a good idea of the program and fast I learned to use very simple tools and started creating a story. It can both be used as a program to do a fast mockup of an idea to an interactive game and can also be created with many different focuses both ethical dilemmas, informative questions etc. I could see myself using it both to create content for teaching students, but also for students themselves to create stories.
  • I started creating my story without any specific idea, but I was surprised how the program sparked creativity and how fast it was to create a story by very simple means. 
  • Besides the setup did not work because of technical issuesI found the format interesting. To be online and get partnered up with somebody, give them feedback but actually never “meeting” them seemed to work for other people in the workshop.

Beside creating my own story I have afterwards also explored the many different interactive stories created by other users. If you want to explore yourself is there here a list of games made with Twine: https://itch.io/games/made-with-twine