On Friday I attended the GCDI Digital Fellow’s workshop Text Analysis with Natural Language Toolkit (NLTK), the function of which the program instructor described as “turning qualitative texts into quantitative objects.” As a complete neophyte to both the Python programming language that NLTK runs on as well as to text analysis, I was eager to assess how easily a newcomer like myself could learn to use such a suite of tools, as well as to continue thinking about how the fruits of such textual quantification might contribute to the meaningful study of texts.
The workshop, which required download of the Anaconda Navigator interface to launch Jupyter notebook, was very useful in introducing and putting into practice core concepts for cleaning and analyzing textual data as expressed in different commands. The “cleaning” concepts included text normalization (the process of taking a list of words and transforming it into a more uniform sequence), the elimination of stopwords (terms like articles that appear frequently in a language, often adding grammatical structure but contributing little semantic content), and stemming and lemmatization (processes that try to consolidate words based on their root and grouping inflected forms of a principal word respectively).
The introductory file library that we analyzed in the workshop included nine texts, among them Herman Mellvile’s Moby Dick, Jane Austen’s Sense and Sensibility, and the King James Version/Authorized Version text of the biblical Book of Genesis. As one would expect, the command text.concordance“(word)” collates all instances of a term’s occurrence within one text. The command text.similar“(word)” seems especially useful: this command ranks words that occur in the same context as the primary term being investigated. Such quantitative ranking of contextually-related terms seems to get closer to the heart of the humanities’ first and last endeavor: the qualitative interpretation of meaning.
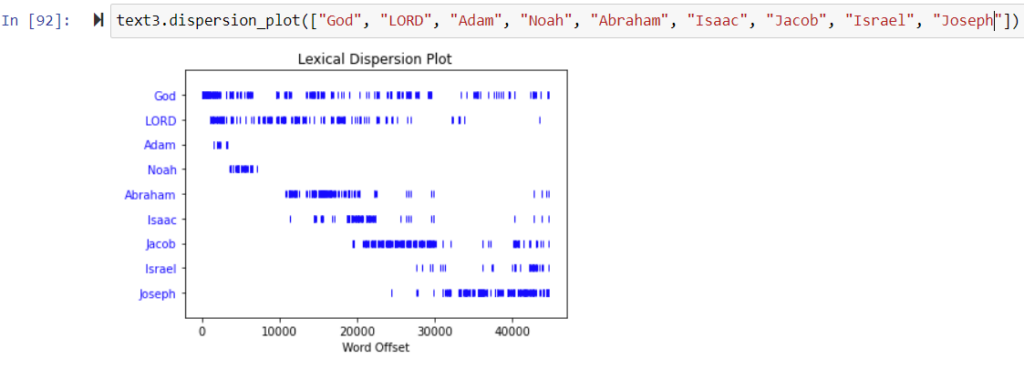
When we were reviewing the different visualizations NLTK could generate, I suggested the following command for Genesis (modified, since the workshop, to include the word ‘LORD’, since the KJV translation of Genesis typically uses ‘LORD’ to render the tetragrammaton ‘YHWH,’ whereas ‘God,’ is employed to render ‘Elohim’; I also added ‘Adam’, ‘Noah’, and Jacob’s alias, ‘Israel’, for good measure) :
text3.dispersion_plot([“God”, “LORD”, “Adam”, “Noah”, “Abraham”, “Isaac”, “Jacob”, “Israel”, “Joseph”])

As one would expect, the resulting visualization conveys a sense of the narrative arc of Genesis based on the lives of the patriarchs as identified by their proper nouns. In demonstrating the narrative relationship between different personages, a visualization of this sort could possibly be useful in the same way as To see or Not to See, the Shakespeare visualization tool demonstrated by Maria Baker several weeks ago.


