Author Archives: Peter Nicholas Otis

Summary of Final Project Proposal-Peter O.

Project name: Borough of Churches Online: Mapping Brooklyn’s Houses of Worship, 1898-2022

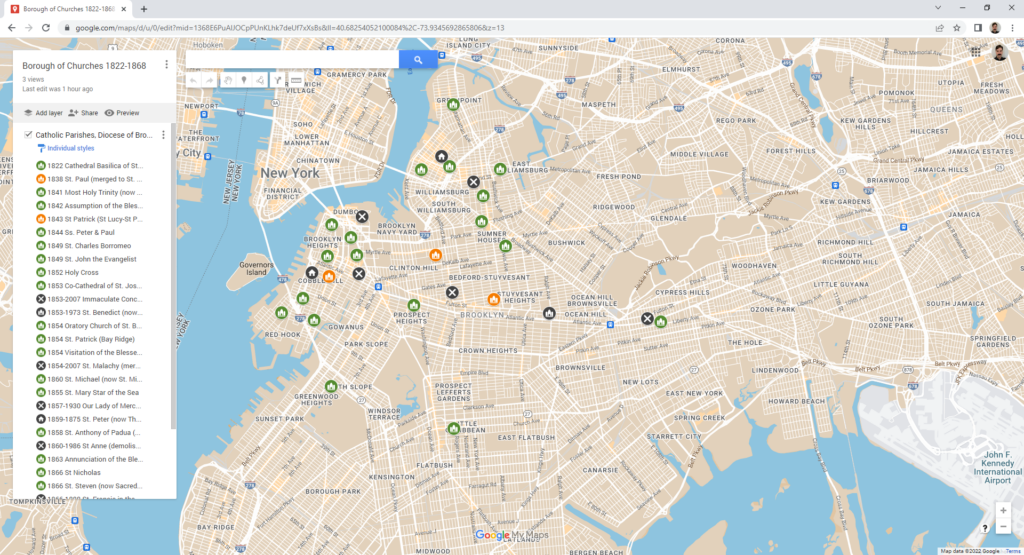
Proposed digital product: A website featuring a primary ArcGIS map displaying all extant, converted to other use, and demolished church buildings within the Borough of Brooklyn between 1898 (the year of Brooklyn’s incorporation into the City of Greater New York) and 2022, supplemented by maps displaying decade-by-decade views (1898-1907, 1908-1917, etc…)

Audience:  This project would be of use to scholars of urban religion, history and sociology investigating a range of questions related to church demolition over time and the effects of this activity on local communities, and would be of general interest to public historians, journalists, students, and preservationists.

Existing models: Existing projects using mapping to study sacred space in the urban landscape tend to lean toward one or another pole in a balancing act between displaying data and telling stories: the needs of a robust reference tool, characterized by geospatial and descriptive precision in the display of a data set as broad and inclusive as the extant sources allow, must be balanced with the needs of user engagement, achieved through selective storytelling by textual, visual, and audible means. The initial phase of the project proposed here focuses on the creation of a reference tool, but hopes to expand into a platform featuring blogpost-style stories and immersive uses of audio and video recordings in future versions.

Groundwork: The most crucial factor in the success or failure of this project hinges on the creation of an original geospatial dataset of the locations of extant and demolished churches based on rigorous historical research into ecclesiastical records, newspapers, municipal (Department of Buildings) records, old maps, and other historical sources and secondary literature on the topic of religious and social life in Brooklyn. This data will then be converted into geospatial data, plotted on the maps described above, and hosted on a content management platform (Drupal, WordPress).

Limitations of the current proposal: The ‘historic’ churches included in this project will most likely be limited to current and former properties of established Christian denominations with presences in Brooklyn dating to at least the early twentieth century, for which useful public and institutional records are most likely to exist, and from which a manageable data set could be established. Regrettably, this risks excluding independent Christian churches and other religious organizations operating out of storefront properties or private homes for which historical data might be lacking, for example former meeting places of Black/African American worship, some of which might not be represented in the sources of the Anglo-American written record.

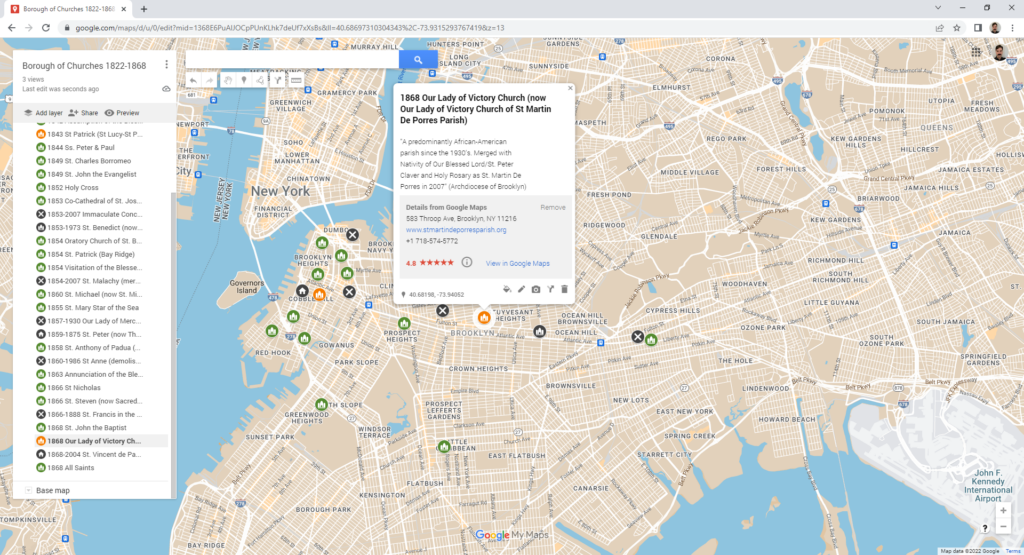
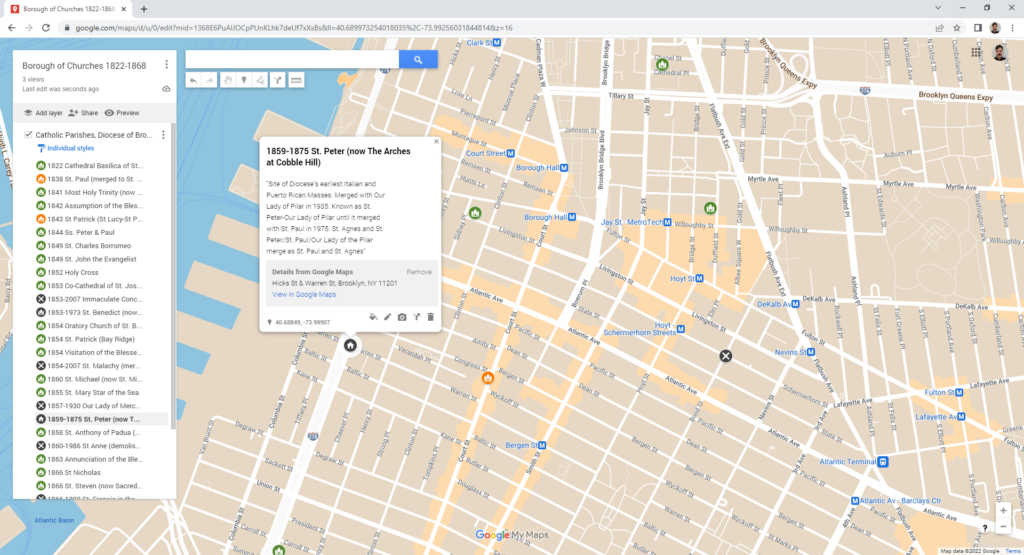
Potential issues for long-term maintenance and access: Even though it is not an open-source software, I selected ArcGIS for its ability to create popup textboxes to display information, a feature vital to this project. A funding source for the future renewal of licensure would need to be determined.

Response to readings 11/30

As K-12 and undergraduate programs continue to incorporate immersive, augmented and virtual reality technologies into lesson plans with ever greater frequency, educators seek, with ever greater rigor and exactitude, to formally assess the quality and efficacy of these tools: from defining a virtual tool’s learning outcomes, to measuring its success in achieving those outcomes, to student perceptions of immersion and usefulness. Hutson and Olsen (2022) and Makransky and Meyer (2022) demonstrate the variety of questions asked–and conceptual categories employed–in assessing augmented reality for education. Drawing theoretical principles from multimedia design, instructional design, and the cognitive-effective model of immersive learning, Makransky and Mayer highlight the importance of conceptually distinguishing between immersion–the concreteness and thoroughness of detail with which a virtual world is constructed, the experiential limits of its horizons defined by its creators—from perception, a student’s subjective sense of being submerged in that virtual world, with limited external distraction. Makransky and Meyer hypothesized that a group of middle school students taking a 360-degree, headset-enabled virtual trip to Greenland to learn about climate change would not only perceive a greater degree of immersion, interest and enjoyment compared to a group of their peers experiencing the same content in standard 2D video format, but would also perform better on immediate and later tests as a result of these higher levels of perception, interest and enjoyment. Their hypotheses validated, the authors reached the following conclusion based on their observations: “It appears that enjoyment and interest are involved in learning but in different ways. Enjoyment directly mediate[d] the results on the immediate posttest but not the delayed posttest. Alternatively, interest directly mediate[d] the results on the delayed posttest but [did not mediate] the immediate posttest” (p. 1787).

Annotations to The Four Dimensional Human

I would annotate the following two sections in the introduction to Laurence Scott’s The Four Dimensional Human: Ways of being in the Digital World:

Today, we live with the sense that un-tweeted, un-instagrammed moments might feel somehow cubic, as in boxed in, just these four walls, unless the walls can be contorted along invisible lines and a message smuggled out. Few people have trouble finding such a smuggler now; it’s a mass industry, this smuggling of life into four dimensions (xvi).

Prompt for students: Consider your personal experience documenting and sharing moments from your life on social media. When you share text, an image or a video online, do you feel that you are sharing or creating an authentic representation of yourself? Does sharing representations of your life experiences in digital form make those experiences feel more “real,” or do you feel differently? 

A crucial tension of our times is that, although we can luxuriate in this gained dimension, stretching our lives into the world like never before, we are simultaneously asked to ignore, deny, accept, strategise or rail against the hypothesis that our physical planet is diminishing (xxi).

Prompt for students: How do you interpret this tension? Does the digital dimension serve more strongly as a catalyst for action, or as an escapist distraction from the social and environmental challenges facing our world?

Response to Readings 11.9.22

With pedagogical considerations in mind, this week’s readings highlight opportunities and strategies for undergraduate students to critically engage texts in meaningful ways using digital platforms, with special attention to student-led annotation. Strategies for fostering student engagement with learning content are discussed in both “Postcolonial Digital Pedagogy” by Roopika Risam as well as “Social Annotation and an Inclusive Praxis for Open Pedagogy in the College Classroom” by Monica Brown and Benjamin Croft. Both texts emphasize digital tools (from text analysis to textual annotation) as means to foster students’ interrogation of the political and cultural structures at work in different texts, to encourage student recognition of their own roles as producers and contributors of knowledge, and to raise consciousness of the power dynamics presumed to be at play (whether implicitly or explicitly) among students in their communal engagement with texts. There is a certain complementarity to reading these articles together, based on where the ‘diverse emphasis’ (for want of a less clumsy expression) falls in each article. Risam’s chapter hones in on diverse learning content–in this case, postcolonial literature produced in the global south in the latter half of the twentieth century–and ways to leverage digital strategies to make that content critically comprehensible to students predominantly steeped in a northern-hemispheric, usually Anglocentric, cultural and literary milieu. Brown and Croft, on the other hand, emphasize a social justice-oriented praxis centered on diverse students, or “the practice of centering the contributions of historically marginalized populations” in student annotation of publicly visible text files (p. 4). The authors pay special attention to the role of the instructor as a sometimes-necessary ‘disruptor’ of ‘power asymmetries’ in instances where such students might feel culturally isolated marking up a text—the example given being “materials that overrepresent whiteness,” which the authors contend “can create an environment” where “students of color may experience harm, lack of safety, erasure, or tokenization” (p. 5). I would have liked the authors to have provided examples to demonstrate such instances where this becomes necessary. 

One of the more salient points made by Cordell in “How Not to Teach the Digital Humanities” is the persistent myth of the digital native–the assumption that new students, whose whole lives experiences are immersed in the digital, are necessarily more adept or competent users than their “digital immigrant” instructors (when in fact, as touched on by Brown and Croft, many students are denied opportunities to develop digital skills by socioeconomic disparities). When I went to Pratt Institute to study library science in 2012, the digital native / digital immigrant dichotomy was still being taught in the core curriculum, its assumptions generally taken as fact. My earliest experiences working in urban public libraries from 2015 onward proved just how fallacious this notion was: it was not uncommon for library patrons in the 20s-to-30s age range to ask help with basic functions that we tend to  take for granted as common knowledge (logging into one’s email on a desktop rather than a smartphone, resetting one’s password, downloading files and uploading attachments, toggling basic printer settings, etc.).

Praxis Assignment: The Decline and Fall of my nascent Text Analysis abilities? I hope not!

For my text analysis assignment, I decided to use Voyant to look at one of the English language’s great historical works: The History of the Decline and Fall of the Roman Empire by Edward Gibbon, published in six volumes (further divided into 71 chapters) over thirteen years from 1776 to 1789. Gibbon’s magisterial study spans a period of over 1,300 years, examining the Roman-Mediterranean world from the height of the classical empire to the fall of Constantinople, capital of the eastern Roman empire (which western authors have anachronistically called the ‘Byzantine’ empire since early modernity), to the Ottoman armies of Mehmet II in 1453. Gibbon’s scholarly rigor, sense of historical continuity, and dispassionate, meticulous examination of original, extant sources contributed to the development of the historical method in western scholarship. Nevertheless, some of Gibbon’s conclusions in the Decline and Fall are also a product of the eighteenth century in which the author lived and wrote, and Gibbon’s writing is occasionally punctuated with moralizing statements (briefly touched on below).

The majority of text analysis experiments seem to focus on works of fiction, paying particular attention to their stylistic and aesthetic dimensions. I asked myself: what about an historical work, which is also a narrative construction? Would running Decline and Fall through Voyant allow a reader to observe trends in the stylistic or moralizing dimensions of Gibbon’s grand historical narrative, beyond what might already be grasped by an ordinary reading the text? (disclosure: I have by no means read all six volumes of Decline and Fall in their entirety). 

I used a plaintext file of Decline and Fall from Project Gutenberg that features an 1836-45 revised American edition containing the text of all six volumes. Prior to uploading this file in Voyant, I removed the hundreds of instances of the word ‘return’ in parentheses (which in the HTML version of the file link to the paragraph location in the text), in addition to the preface and legal note at the end of the work authored by Project Gutenberg. After uploading the file, I added additional stopwords to Voyant’s auto-detected list. The terms I removed relate to chapter headings (e.g., Roman numerals), citations (‘tom’ for tome, ‘orat’ for oration, ‘epist’ for epistle, ‘hist’ for historia’, ‘edit’ for edition and so on), and occasional Latinate (‘ad’, ‘et’) and French (‘sur, ‘des’) words. To this end, the word cloud tool was helpful for identifying terms that should be added to the stop-word list.

The resulting word cloud was, to say the least, neither surprising nor particularly revealing nor useful, most of the terms referring to the work’s predominant subjects: 

Standing out as one of the only abstract terms visible in the cloud limited to the top 75 words, however, was “character,” with 828 occurrences. Navigating to the ‘Contexts’ tab, I generated a concordance displaying instances of ‘character,’ which revealed a plethora of specific adjectives used in Gibbon’s text, for example, “manly.” Running ‘manly’ through the ‘links’ generator reveals a network of terms that reflect classical Roman definitions of masculine virtue (‘virtue,’ ‘spirit,’ ‘resolution,’ ‘freedom’) and one usage related to physical appearance (‘countenance’):

These results are once again neither surprising nor interesting, since the ancient (male) writers informing Gibbon’s work were themselves concerned with writing about the meritorious qualities and/or vices of individual male leaders for moralizing, didactic purposes, be they emperors, generals or bishops. This calls to mind Michael Witmore’s observation that “what makes a text a text–its susceptibility to varying levels of address–is a feature of book culture and the flexibility of the textual imagination” (2012). These particular examples may demonstrate the influence of classical authors on Gibbon’s narrative, but they do not necessarily convey anything about what is original in Gibbon’s prose (or, differently stated, original to Gibbon’s contemporary setting).

Perhaps one could get closer to an analysis that better reflects Gibbon’s original, polemical thesis and writing style by first 1) identifying a comprehensive list of moralizing terms (including adjectives like ‘superstitious’ and its variants) harvested from the whole text, and then 2) analyzing the occurrences of those terms in the text, and 3) looking for trends in how those terms are employed throughout the text to describe different social, ethnic, religious or occupational groups. As an enlightenment scholar critical of organized religion, Gibbon maintained that the rise of Christianity led to the fall of the western empire by making its denizens less interested in the present life, including in things civic, commercial, and military, the latter of which would have obvious consequences for the defense of the empire against invasion (Gibbon’s thesis is not generally shared by scholars today). Would such an experiment reveal more exactingly where Gibbon’s moralizing emphases change, based on the chapter or volume of the text where such terms occur?

Workshop Review: Text Analysis with Natural Language Toolkit (NLTK)

On Friday I attended the GCDI Digital Fellow’s workshop Text Analysis with Natural Language Toolkit (NLTK), the function of which the program instructor described as “turning qualitative texts into quantitative objects.” As a complete neophyte to both the Python programming language that NLTK runs on as well as to text analysis, I was eager to assess how easily a newcomer like myself could learn to use such a suite of tools, as well as to continue thinking about how the fruits of such textual quantification might contribute to the meaningful study of texts. 

The workshop, which required download of the Anaconda Navigator interface to launch Jupyter notebook, was very useful in introducing and putting into practice core concepts for cleaning and analyzing textual data as expressed in different commands. The “cleaning” concepts included text normalization (the process of taking a list of words and transforming it into a more uniform sequence), the elimination of stopwords (terms like articles that appear frequently in a language, often adding grammatical structure but contributing little semantic content), and stemming and lemmatization (processes that try to consolidate words based on their root and grouping inflected forms of a principal word respectively). 

The introductory file library that we analyzed in the workshop included nine texts, among them Herman Mellvile’s Moby Dick, Jane Austen’s Sense and Sensibility, and the King James Version/Authorized Version text of the biblical Book of Genesis. As one would expect, the command text.concordance“(word)” collates all instances of a term’s occurrence within one text. The command text.similar“(word)” seems especially useful: this command ranks words that occur in the same context as the primary term being investigated. Such quantitative ranking of contextually-related terms seems to get closer to the heart of the humanities’ first and last endeavor: the qualitative interpretation of meaning.

When we were reviewing the different visualizations NLTK could generate, I suggested the following command for Genesis (modified, since the workshop, to include the word ‘LORD’, since the KJV translation of Genesis typically uses ‘LORD’ to render the tetragrammaton ‘YHWH,’ whereas ‘God,’ is employed to render ‘Elohim’; I also added ‘Adam’, ‘Noah’, and Jacob’s alias, ‘Israel’, for good measure) :

text3.dispersion_plot([“God”, “LORD”, “Adam”, “Noah”, “Abraham”, “Isaac”, “Jacob”, “Israel”, “Joseph”])

As one would expect, the resulting visualization conveys a sense of the narrative arc of Genesis based on the lives of the patriarchs as identified by their proper nouns. In demonstrating the narrative relationship between different personages, a visualization of this sort could possibly be useful in the same way as To see or Not to See, the Shakespeare visualization tool demonstrated by Maria Baker several weeks ago. 

Praxis assignment: Mapping the City of Churches

Although my engagement with this week’s praxis assignment has not yet resulted in any especially useful or meaningful results (chalk it up to the monotony of data entry), the process has nevertheless helped me to think about the kind of historic mapping project I might like to propose for our term project, and the challenges of visually representing historic data involved: something I might name City of Churches: Mapping Religious and Social Change in Brooklyn.

I believe that the lives, deaths and continuities of churches, synagogues, mosques and other religious buildings, considered as part of the same data set and viewed over time, have the potential to provide a valuable lens through which to view social and demographic change, and to discern patterns of urban development in the City of New York. Buildings of worship–frequently architecturally significant, although not always legally protected as landmarks–are not only material witnesses to the histories of different ethnic, immigrant and faith-communities past and present: they comprise, alongside other historic structures, the unique texture of the urban built environment. This is as true for Brooklyn as for the other boroughs, which in the nineteenth century was known as the “City of Churches” due to the rapid pace of its construction of ecclesiastical edifices, belonging to different denominations and spanning a number of different architectural styles. In addition to providing a sense of community and place, charitable services based out of religious building complexes also provide crucial social and material support to struggling families and individuals.

Taking into consideration issues related to historic preservation and cultural heritage, as well as the demography of urban religion, the goal of my mapping project would be to: 

  1. Track the construction, conversion and/or demolition of religious edifices and related properties in the borough of Brooklyn over time, from at least the early nineteenth century to the present. 
    1. Ideally, this information would be best conveyed on an animated time lapse map that would convey the appearance, conversion and disappearance of nodes over time. Such a map could also be paused and viewed statically.
    2. Each node on the map representing a standing, converted or demolished religious edifice, could be selected to interactively display:
      1. Historical information, including facts, articles photographs, etc.; as well as 
      2. Current demographic information about each respective node’s congregation/parish (if available), including information about social services (food pantries, larger aid networks, etc.) accessible at each node 

Questions I intend to ask myself while working on this map include: 

  • What does a community lose when it loses a church building, in terms of cultural heritage, social support or otherwise? 
  • If a former religious property is converted to private use (say, market-rate condos) or demolished (to build, say, yet more market-rate condos or Vornado office towers), who ultimately benefits from doing so?
  •  Are historical and recent trends and patterns in religious and sociodemographic change (including gentrification, for example) more easily discerned by presenting this information cartographically? 
  • Could displaying this information cartographically have an impact on public attitudes regarding the preservation of these structures?

For the sake of completing this praxis assignment, I attempted to create a static map from information of just one religious organization that was readily available: current and former parishes of the Roman Catholic Diocese of Brooklyn, available on the website of the diocesan archives (ideally this project would include multiple denominations and religions–this is just a place to start). I began to manually enter data into Google Maps (I was hoping to export this layer as a .CSV file, and then import this file into my Student Developer account of CartoDB, but I encountered an obstacle involving linking to data storage).  

To create location nodes for parish churches that no longer exist, I relied on older authoritative sources like Henry Reed Stiles’ Civil, political, professional and ecclesiastical history, and commercial and industrial record of the County of Kings and the City of Brooklyn, N. Y. (New York: Munsell, 1884) to manually plot the location nodes. This can be challenging when an explicit description of where on a street (or on which corner, etc.) a specific structure used to be is lacking. 

The version of my very rough work in progress (linked here) only displays the sites of current and former parish churches of Brooklyn founded in the nineteenth century from the years 1822 to 1868 (representing only 30 nodes out of a total 144 Brooklyn Catholic parishes to be plotted, at least 28 of which represent churches that no longer exist, whether demolished or converted to other uses).  Since I am using a static rather than an animated map, I am constrained to symbol and color to convey historical change. The symbols currently in use on my map are as follows:

  1. Sites of properties currently associated with the Catholic Diocese of Brooklyn:
    1. Church (green): The extant church building on site is still in use as the home address of its own parish
    2.    Church (orange): The extant church building is still in use by the diocese/community, but its original parish has been merged to another address or is defunct.
  2. Sites of properties no longer associated with the Catholic Diocese of Brooklyn:
    1. Church (grey):  building owned and used for worship by another denomination or religion (in a map displaying the properties of multiple religions, this would be displayed by another color or symbol)
    2. House (grey): exterior physical structure of church building still intact, converted to residential use (I would need to select a separate icon for commercial or communal use)
    3. ‘X’ (grey): building demolished.

As a functional historical lens on the changing religious life of Brooklyn over time to the present, this project would only be as effective as the breadth and depth of the data included. That being said, such a project would be biased in favor of well-established dioceses and independent organizations that have historically maintained strong archival and recordkeeping operations. Although the mainstream organizations by and large serve immigrant and low-income communities, there is always a risk that many small, independent places of worship (perhaps based out of physical spaces not generally considered to be of historical importance) that serve these same populations might go unaccounted for–whether due to the fleeting existence of a defunct organization’s address in the historical record or lack a discoverable online presence.

Defining DH according to the Early Caribbean Digital Archive: using digital means to transcend the limitations of physical sources and inherited forms of knowledge organization

A perennial challenge among historians who attempt to reconstruct the lives of underrepresented groups in the premodern, early modern and modern periods is making the silence of the sources “speak” to the authentic experiences and identities of those groups. Surviving bodies of archival sources that ostensibly describe marginalized or oppressed persons, whether narrative or documentary in content, tend overwhelmingly to be recorded by the conqueror or the social hegemon, and therefore are biased by the power dynamics of authorship; that of propertied white men, in the context of transatlantic commerce and slavery in the early modern period. This presents two challenges:

  1. Trying to tease out of the texts—beyond the biases or power-motivations of the authors—evidence for the authentic lived experience of the marginalized persons described; and
  2. Extracting and presenting this evidence in ways that center marginalized persons as agents and proper subjects, rather than as passive objects of colonial knowledge.

To achieve these ends, the Early Caribbean Digital Archive takes the digital medium of its endeavor as its starting-point for the decolonization of early modern knowledge. As noted on the page Decolonizing the Archive: Remix and Reassembly, the digital archive affords possibilities for re-centering oppressed persons and drawing new connections across inherited bodies of organized knowledge in ways that traditional, analog formats could not. Beyond digitally extracting, remixing, recombining and uniting digital facsimiles of disparate printed sources–-as many digital history projects already do-–the ECDA demonstrates its specifically post-colonial aspirations by subverting the the notion of “authorship” through its embedded slave narrative collection, in addition to the creation of independent, searchable library catalog records resulting from these extracts:

…instead of (only) reproducing the authorial status of “Bryan Edwards” as it has appeared on the spine of his well-known book, History, Civil and Commercial, of the British Colonies in the West Indies (1793) for more than 200 years, the ECDA has also extracted the story of an enslaved woman named Clara from that text and placed her name in the identifying category of author of “Clara’s Narrative.” We are collecting a growing number of similarly embedded slave narratives, extracted from texts written by European colonial authors, which we have remixed to form a new digital anthology of narratives that speak to one another (beyond the context of the words of Bryan Edwards or similar texts) in new ways and across new contexts.

A brief look at the digital library record for Narrative of Oliver extracted from Edwards’ History is demonstrative. Oliver, a 22-23 year old slave taken out of present-day Ghana, is centered not only as the author of the text extracted from Edwards’ work, but is also treated as the proper subject of the extraction’s own library record. The addition of subject keywords (“slave narratives,” “Assiantee Country,” “Ghana”) to this unique record enable Oliver’s narrative to be discoverable by keyword search on the Northeastern Uiniversity Library Digital Repository Service in a way that it might not otherwise be in other digitized editions of Edwards’ History.