
Although my engagement with this week’s praxis assignment has not yet resulted in any especially useful or meaningful results (chalk it up to the monotony of data entry), the process has nevertheless helped me to think about the kind of historic mapping project I might like to propose for our term project, and the challenges of visually representing historic data involved: something I might name City of Churches: Mapping Religious and Social Change in Brooklyn.
I believe that the lives, deaths and continuities of churches, synagogues, mosques and other religious buildings, considered as part of the same data set and viewed over time, have the potential to provide a valuable lens through which to view social and demographic change, and to discern patterns of urban development in the City of New York. Buildings of worship–frequently architecturally significant, although not always legally protected as landmarks–are not only material witnesses to the histories of different ethnic, immigrant and faith-communities past and present: they comprise, alongside other historic structures, the unique texture of the urban built environment. This is as true for Brooklyn as for the other boroughs, which in the nineteenth century was known as the “City of Churches” due to the rapid pace of its construction of ecclesiastical edifices, belonging to different denominations and spanning a number of different architectural styles. In addition to providing a sense of community and place, charitable services based out of religious building complexes also provide crucial social and material support to struggling families and individuals.
Taking into consideration issues related to historic preservation and cultural heritage, as well as the demography of urban religion, the goal of my mapping project would be to:
- Track the construction, conversion and/or demolition of religious edifices and related properties in the borough of Brooklyn over time, from at least the early nineteenth century to the present.
- Ideally, this information would be best conveyed on an animated time lapse map that would convey the appearance, conversion and disappearance of nodes over time. Such a map could also be paused and viewed statically.
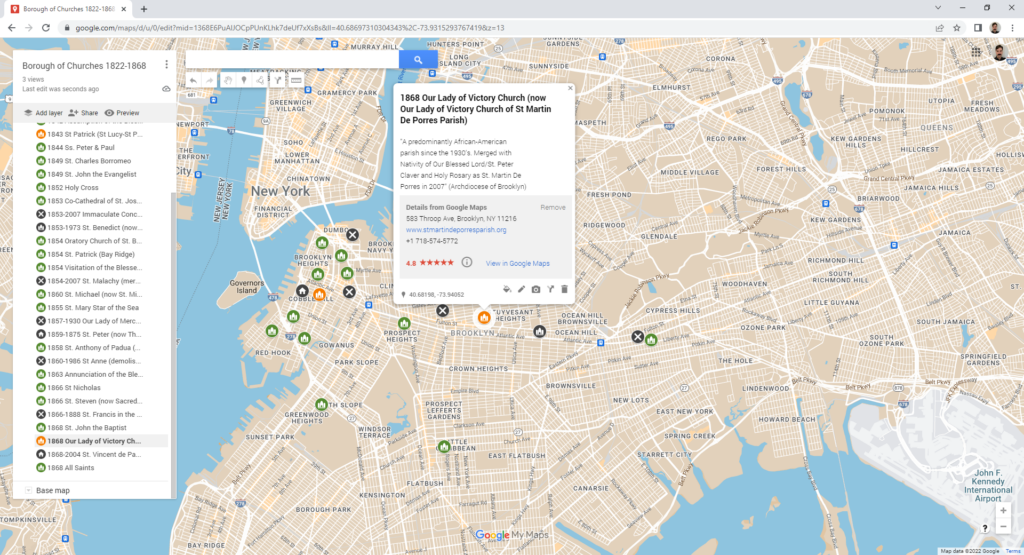
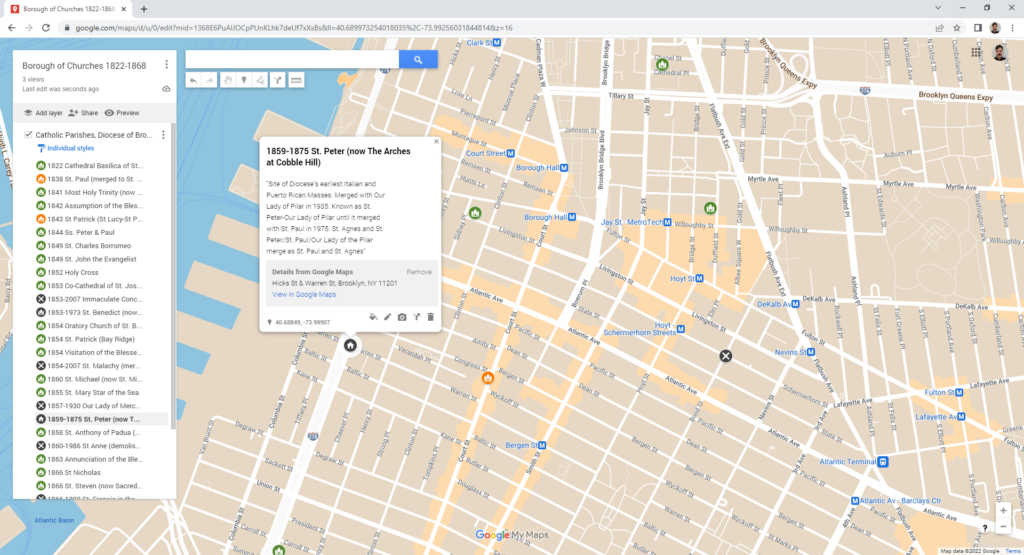
- Each node on the map representing a standing, converted or demolished religious edifice, could be selected to interactively display:
- Historical information, including facts, articles photographs, etc.; as well as
- Current demographic information about each respective node’s congregation/parish (if available), including information about social services (food pantries, larger aid networks, etc.) accessible at each node
Questions I intend to ask myself while working on this map include:
- What does a community lose when it loses a church building, in terms of cultural heritage, social support or otherwise?
- If a former religious property is converted to private use (say, market-rate condos) or demolished (to build, say, yet more market-rate condos or Vornado office towers), who ultimately benefits from doing so?
- Are historical and recent trends and patterns in religious and sociodemographic change (including gentrification, for example) more easily discerned by presenting this information cartographically?
- Could displaying this information cartographically have an impact on public attitudes regarding the preservation of these structures?
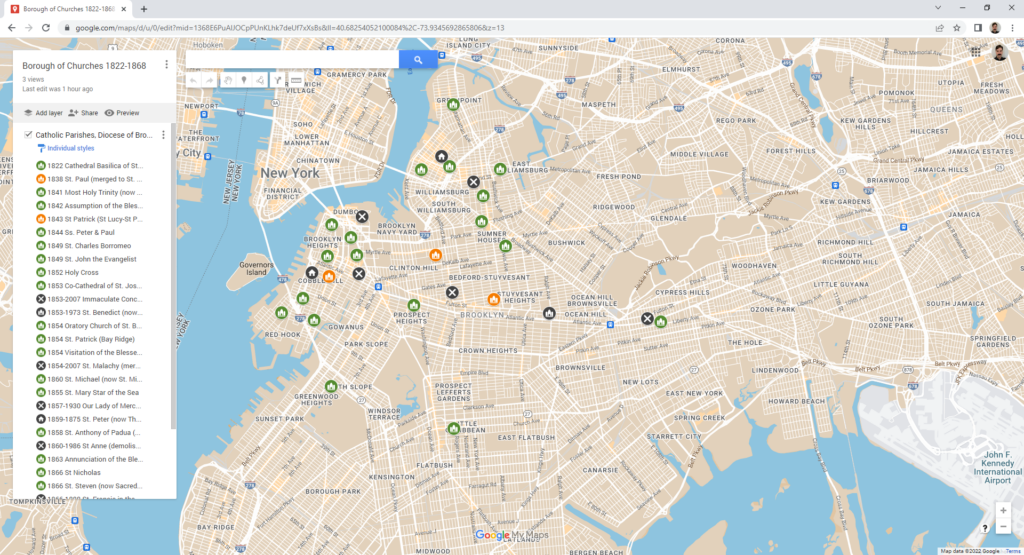
For the sake of completing this praxis assignment, I attempted to create a static map from information of just one religious organization that was readily available: current and former parishes of the Roman Catholic Diocese of Brooklyn, available on the website of the diocesan archives (ideally this project would include multiple denominations and religions–this is just a place to start). I began to manually enter data into Google Maps (I was hoping to export this layer as a .CSV file, and then import this file into my Student Developer account of CartoDB, but I encountered an obstacle involving linking to data storage).
To create location nodes for parish churches that no longer exist, I relied on older authoritative sources like Henry Reed Stiles’ Civil, political, professional and ecclesiastical history, and commercial and industrial record of the County of Kings and the City of Brooklyn, N. Y. (New York: Munsell, 1884) to manually plot the location nodes. This can be challenging when an explicit description of where on a street (or on which corner, etc.) a specific structure used to be is lacking.
The version of my very rough work in progress (linked here) only displays the sites of current and former parish churches of Brooklyn founded in the nineteenth century from the years 1822 to 1868 (representing only 30 nodes out of a total 144 Brooklyn Catholic parishes to be plotted, at least 28 of which represent churches that no longer exist, whether demolished or converted to other uses). Since I am using a static rather than an animated map, I am constrained to symbol and color to convey historical change. The symbols currently in use on my map are as follows:
- Sites of properties currently associated with the Catholic Diocese of Brooklyn:
- Church (green): The extant church building on site is still in use as the home address of its own parish
- Church (orange): The extant church building is still in use by the diocese/community, but its original parish has been merged to another address or is defunct.
- Sites of properties no longer associated with the Catholic Diocese of Brooklyn:
- Church (grey): building owned and used for worship by another denomination or religion (in a map displaying the properties of multiple religions, this would be displayed by another color or symbol)
- House (grey): exterior physical structure of church building still intact, converted to residential use (I would need to select a separate icon for commercial or communal use)
- ‘X’ (grey): building demolished.
As a functional historical lens on the changing religious life of Brooklyn over time to the present, this project would only be as effective as the breadth and depth of the data included. That being said, such a project would be biased in favor of well-established dioceses and independent organizations that have historically maintained strong archival and recordkeeping operations. Although the mainstream organizations by and large serve immigrant and low-income communities, there is always a risk that many small, independent places of worship (perhaps based out of physical spaces not generally considered to be of historical importance) that serve these same populations might go unaccounted for–whether due to the fleeting existence of a defunct organization’s address in the historical record or lack a discoverable online presence.

This entry is licensed under a Creative Commons Attribution-NonCommercial-ShareAlike 4.0 International license.
Peter,
Your project expanded my view of churches because I’ve been photographing churches in NYC for a long time and have very often wondered how many there are here. There’s one almost on every street and that has always drawn me in from a photographic perspective. Ignorantly, I hadn’t thought of their social aspect- their raison d’etre. Ahh! Your post expanded my curiosity beyond my blind spot of looking at them in an architectural vein to a social vein. Cheers.