
Author Archives: JP Essey
Short Reflection on Annotation Praxis Project
highlighted A hundred years after its heyday, we’re only now inhabiting space in a way that could be called four-dimensional.
ME How do you understand this sentence? What do you understand from the concept of ‘four-dimensional space”? Can you connect it to anything else that you think of as ‘four-dimensional”? Have you seen or heard of it in a movie, TV show or book before?
highlighted With walls not being what they once were, the home itself has become four-dimensional, with new ground plans to match its digital environment.
ME How do you understand this sentence? What do you think the author means by this? How is a person’s home different now that it is ‘four-dimensional”? Can you give an example of what makes it different? Is your home different than an older one you visited? Your grandparents’ home, for example?
Reflection
My questions were intended to achieve an active connection with the text. I wanted the students to think about the particular sentence and stimulate previous thinking on the idea and to spark any connections they may have had with the ideas. I also wanted them to connect the ideas to their present situation or connect it to their own homes or lives. I hoped to have them engage a bit more by asking those questions.
Text Analysis with Voyant
For this assignment, I had several novel in mind to use in Voyant. With each novel I had certain impressions about repeating words. For The Great Gatsby and The Bluest Eye, I noticed the use of colors in the novel and wanted to find out how much was used and if they were similar. I had the impression that colors were used a lot in both novels, specifically the colors blue and yellow. The impression I had for The Day of the Locust was somewhat similar but the colors mentioned in the book were different, bordering on the metallic scale of colors.
I analyzed each book individually and was surprised by the results. I expected to see a lot of usage for colors in each novel. However, that was not the case. The results were quite different than what I expected. Colors barely showed up on the visualization part of the program.
Great Gatsby
Although the novel is very visual descriptively, the result from Voyant showed a different visual than the one that I had expected to see. ‘Gatsby’ and ‘Daisy’ showed up, but ‘Tom’ showed up more that ‘Daisy’ and, surprisingly, ‘house’ showed up even more than those. Also surprising was the number of times ‘eyes’ was used. Most all of this was new information.
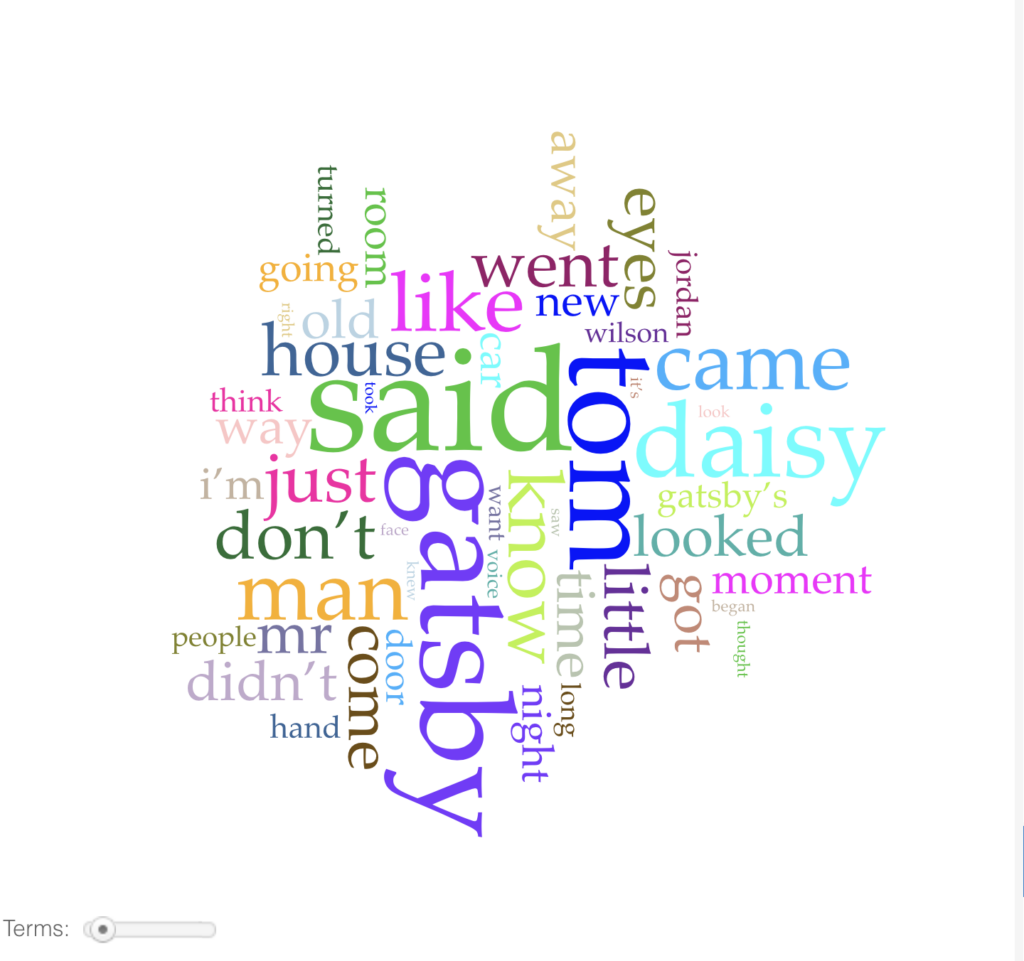
https://voyant-tools.org/?corpus=1f6377e12f4415d8302d8b4b5e0f94d6
Bluest Eye
A similar experience happened in the novel. Whereas I was expecting to see many colors, only the color of the title was prominent. What was surprising was ‘Cholly” , “don’t” and “know” showing up as much as they did.

https://voyant-tools.org/?corpus=5341dcf69e2b4eb3fd9b99c964f55855
Day of the Locust
At this point, I lowered my expectation as to what to expect since the images I had in mind and what Voyant visualized were different. What was surprising here was to see ‘Earle” whom I had thought as a somewhat minor character show up many times.
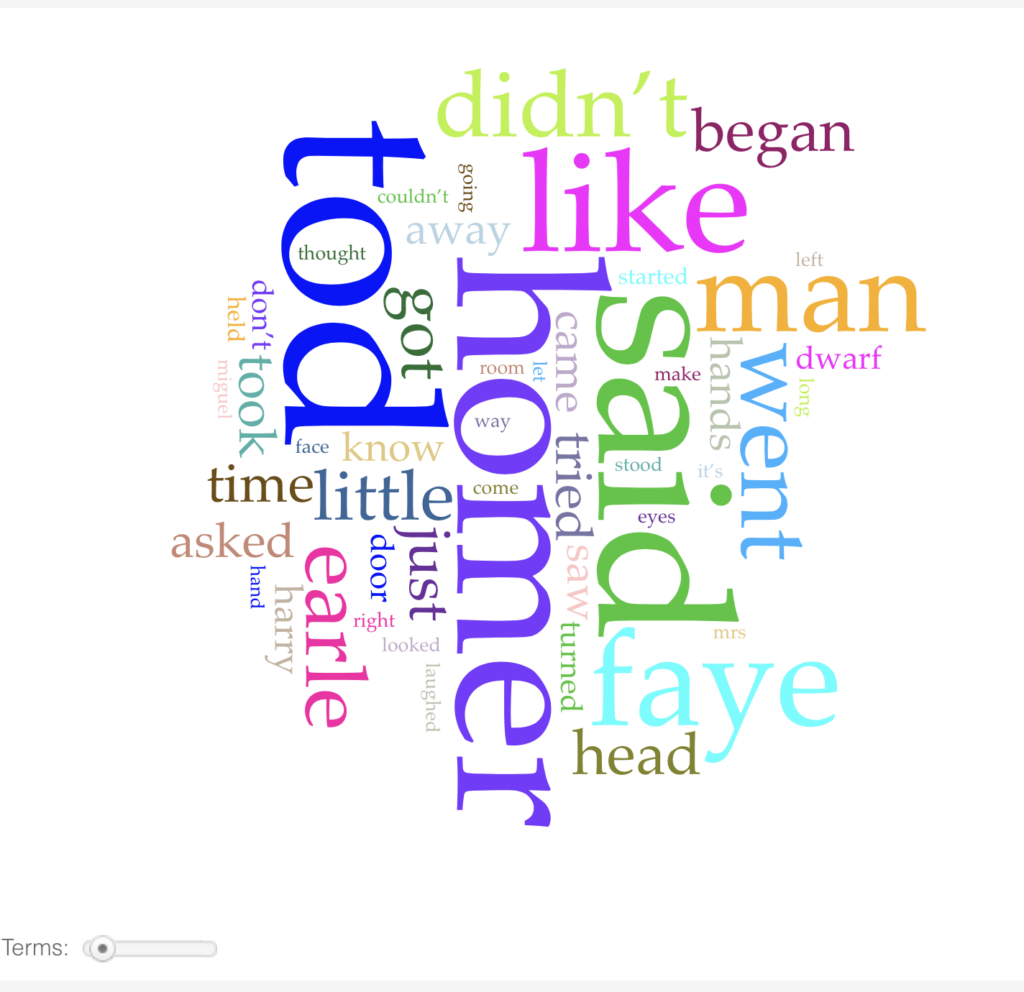
https://voyant-tools.org/?corpus=03ddb1d009689725c1ccbaa69ef0943e
Using this tool gave me a nice visual aspect to view the novel and expand how I analyze it. With the prominence of certain words or characters, I am able to add another component to how to interpret a novel. Voyant is another tool to add to the toolbox.
Zotero Workshop
I just finished a Zotero tutorial with one of the librarians and would like to share what I have learned.
Zotero is an open-source reference management application and add-on to manage bibliographic data and sources. It was developed and is managed by the non-profit Corporation for Digital Scholarship at George Mason University. It gives users a free cloud account with 300 MBs of storage and has options to have larger storage for a small fee. The program offers many helpful tools to make researching, organizing, citing, and creating bibliographic information easy or easier and a much less time-consuming task.
Organizing
The interface is relatively simple and straight forward. There are different ways to organize one’s resources:
- The user can create Collections or Folders and subdivisions. Having sources for each project is easy and can be placed in the same collection.
- Tags can be added to each source or piece of material. This makes sorting or searching for items easy.
- Related references can be linked that are located in different places in the library.
- Notes can be added to sources or materials. This is similar to a stickie or Post-it, called Child.
There are 4 ways to add sources or materials (e.g. screen shots) in Zotero.
- One way is to manually enter the information: author, title, publisher, etc.
- A user can just drag a PDF into a collection and the program will automatically fill in the information.
- Entering an Identifier (PMID, ISBN, etc.) is another option.
- Using a browser plug-in will also work.
All of these will activate Zotero to fill in the bibliographical information of the source. One very helpful feature is that if a user right-clicks on a source in the collection and the source is Open Access, Zotero will retrieve the PDF and add it to the collection.
Citing
The program will cite sources in the body pf the writing as well as organize a bibliography for the work. Again, there several ways that a user can do this, either in the program itself or as part of a writing program.
- A very helpful and time-saving feature is to generate a source page (Bibliography, Reference, Works Cited, etc.) for one’s work. From the program, one can right-click on an option and a very large selection of styles will appear. The usual styles (Chicago, MLA, APA, etc.) are there along with a large host of others. One can fine tune a style, add their own or retrieve another. This makes it very adaptable to one’s needs.
- Adding an in-text citation while writing is also another feature. And, again, one can choose the style to use for the citation. Zotero will automatically add the citation and or footnote or whatever is correct in the style.
A user can add Zotero to a word processing program such as LibreOffice Writer, Microsoft Word or another program. When that is done, a Zotero icon is added to that program and the same citations can be done with the click of a button.
Groups
Another feature in the program is the ability to create a group page. This is helpful for group projects where the group can input and share sources. The individual setting up the group has the ability to set perimeters as to what members can do. The group can store, add, edit or, search sources.
The workshop was extremely helpful in learning the program and its time-saving features. I also left with many other helpful tidbits of information such as the Hathi Trust database, LibreOffice Writer (open source instead of MS Word) and other nuggets. I’m sure anyone writing in either academia or similar professions will benefit from this program, and it’s good to know if that if an individual subscribes for extra storage then it will benefit a non-profit company rather than a big tech behemoth.
Media in Life
As usual, this week’s readings were very thought provoking. The readings that resonated with me were by Chatelain and Deuze et al. I appreciated Chatelain’s insight about how time is compartmentalized for most of us yet is not brought to our forethoughts. It was insightful for her to point out that in the academy, one is evaluated by their use of time, which is a bit unusual in the working mode for most people. How time is spent, evaluated and treated was the criteria in her academic career. She was able to shift the dialogue to an expansive view to include social media. Her success in using Twitter to engage many people to become actively involved in their community as well as connect to other communities across physical boundaries was a successful use of social media to stimulate change. Her act of rebellion against staying in the Ivory Tower caused a cascade of actions where scholars connected with a wide variety of fields not usually tapped, such as elementary school teachers. This dual aspect of social media to cause global connections and at the same time stimulate the local community was also seen in the Deuze et. al. article. As they state,” …media that our children experience are[…] a mixture of national, regional and global. These media can serve to maintain national allegiances and offer a view of the world that reconnects children with another history or opens a window to a new world.” It makes sense that a young adult watching a TikTok video of a person dancing or playing a prank on the other side of the world will connect to it as well as the person. Ah, they are another person just like me is an unconscious idea. No matter that they are Asian, Indian, Nigerian or Swedish. A connection is made on a purely human level eradicating a bias and thus causing one more iota of an ism to fade away. Whether it is racism, sexism or any other. Both the global and the local are affected. Yet, I have a hindrance to me, a human, being negated and my ontological existence is subsumed by media and I am unable to” live a life without by wireless.” There is an assumption being made as well that one cannot live without being fully immersed in media to the point where my body is media. This is overkill to say the least. “…a life in media is at once connected and isolated, requiring each and every individual to rely on their own creativity to make something out of life: not just to give it, but to symbolically produce it,” is a stretch of a statement. It reeks of being patronizing and deterministic because it assumes that we, as individuals, are helpless without media to develop ideas, identities, goals, aspirations. Tools determine my upbringing and consequently my being. It is not my parents, my socialization, my learning. It is the tools. While media tools do in fact expand one’s connection to the world, they do not form the individual. People use media and let’s hope the converse will never be true.
Yes But
The readings for this week were a bit less connected than I had anticipated, not bad, just surprising since the other readings revolved around 1 topic. The Risam reading pointed out simple concepts yet with profound ramifications. The design concept of ‘Less is more.” applies in DH also. Not having to chase the latest and most powerful tools, one can still get the work done and even make it more egalitarian. However, I noticed several points which seemed inconsistent. I appreciated the mention in the reading of, “documentary culture… has been profoundly shaped by colonialism” while they acknowledge “being postcolonialist advocating for a universal implementation to computing’ as being contradictory, yet they do not satisfactorily respond to it. They go on to state,” At the heart of this state of affairs is the role of capital in the control of scholarly production.” Yes, but doesn’t that have to be so? Isn’t having capital also a necessity for having access to digital computing or archives. Something seemed missing from the conversation.
The Michael et. al article reminded me of a Drucker article I read, The Virtual Codex from Page Space to E-space. We are in the digital realm and it is expanding to engage us in the realm of books. Drucker discussed that books are not about what they are but what they do, and for us to continue along that line of thinking we must access digital realms that extend what books do. The way a book works is best described with an architectural metaphor of ‘program,’ which constitutes activities. The ‘program’ of a book is the activities derived from it. So, it makes natural sense that Manifold or hybrid publishing is the next iteration of the activity.
The readings regarding Open Access gave me a pause. I appreciate the concept of Open Access to make for a more egalitarian society. However, again, something seemed missing. Something I can’t put my finger on yet is a big blind spot. I appreciated the concept of allowing all to access anything. I think OER is a good choice for some classes. I think that breaking down barriers to education is important. But, I have questions that come up and some that are slightly below the surface where I can’t articulate them yet. For example, how are we to pay for a writer? How would a writer sustain a family with that sort of livelihood? The person or people who write text books take several years to write one, and the sales and circulation of the books is not substantial. How will they support a family if the book is made free of charge? What if they are not full time or tenured? Are we eradicating the profession of a writer? What happens when everything is free? Does the adage of ‘Too much of a good thing is not good.’ apply here? There isn’t a person who knows me who has not heard me laud the tremendous wonders of free courses from iTunes University (just closed) to all of the Open Courses in many of the major universities, yet of the hundreds (if not more) of the people I have told how many actually took one or listened to one? Again, something is missing, but I’m not sure what. The concept seems nice, but I have questions as to the implementation and results The readings gave me many ideas about open access, but also gave me just as many questions.
For those interested in public access sites, OER or Open Courses here are a few:
https://online.stanford.edu/free-c
http://pressbooks.oer.hawaii.edu/oertraining2018/
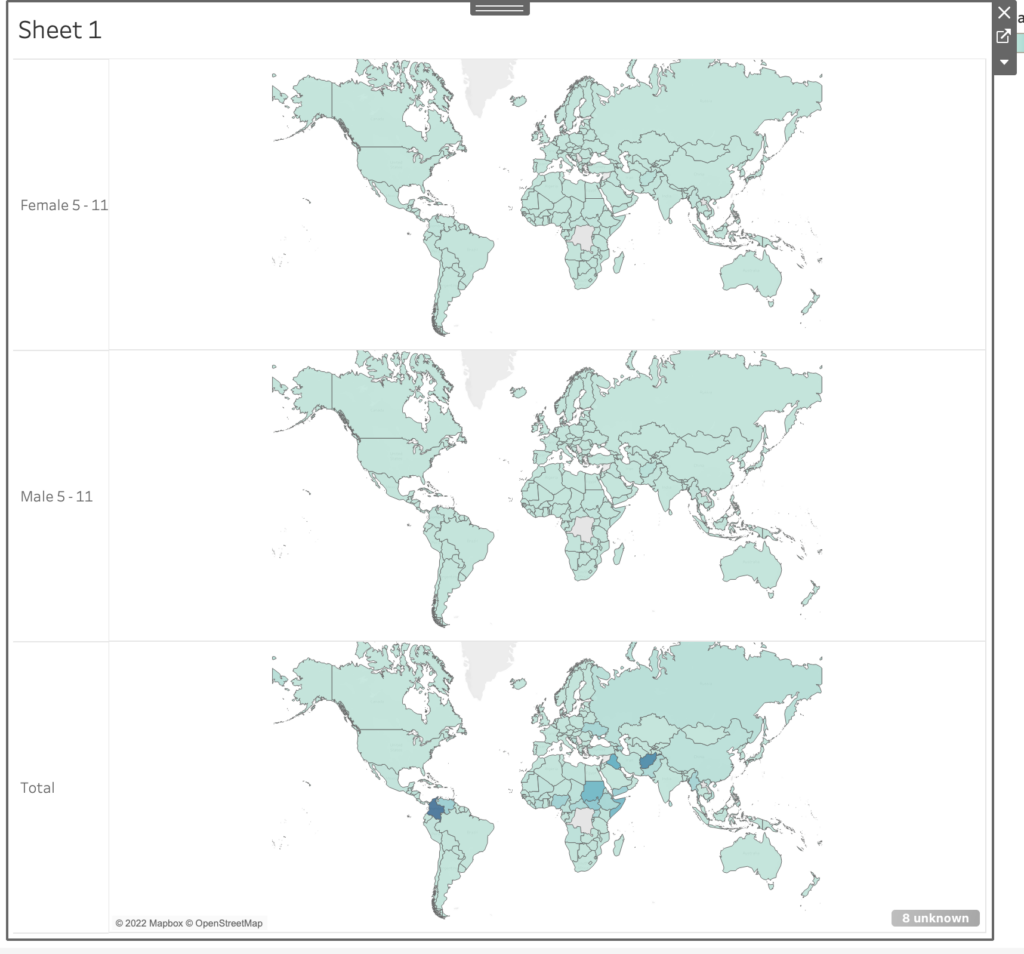
Worldwide Refugees in 2021
My mapping assignment has been a winding road passing many villages of programs to get to the goal of a map. When I first thought about the assignment, my first idea was to think of mapping the immigrant community in NYC by zip code with layers of supermarkets in each zip code with layers of farmers markets and community gardens in each area as well. The idea was to show the preponderance of food deserts. I started my journey by going to QGIS which I understood to be the standard. After an hour with the program, I realized that the learning curve was too steep for me. I went over to Google Maps, which was unappealing. I finally settled on Tableau. After watching about 6 YouTube videos on learning the basics, I felt I had an idea on how to proceed. I started looking for datasets to input or connect to Tableau. I ran into some issues as to finding the datasets I was looking for. Finding the data was challenging as there wasn’t one place for me to gather what I was looking for, so I decided to go to the UN as it was one location that was organized. I changed my topic to the number of refugees worldwide and downloaded datasets about that. The dataset was overwhelming as it spanned years and had a very large subset of categories. I tried to work with what I had but ran into many issues. I even stripped the data to only include one year but still got stuck on how to proceed. This is when I reached out to Filipa who was extremely helpful and patient. She said she would learn Tableau to help me out! Something I said would not be really necessary as I can ask for another tutor, but she did it anyway. Not only that, but she went to the UN site and retrieved a dataset that was much more different than mine. What she showed me was that my original dataset was incomplete in some ways and too much in other ways. She also showed me how to be extremely selective in choosing the dataset for mapping. From there, she helped me to fine tune the map I started with. This became the present map that I share with the class. It is a map, actually 3, of refugees in the world in 2021: 1 is the total number in each country; one is the number of females 5-11 years old; one is the total number of males 5-11 years old; and the last one is the total number of all refugees. It was exciting to finally get a finished project. Although it may be finished for the assignment, I’m intrigued to see how I can add one or 2 more layers to the map. Perhaps the number of organizations helping in each country or the number of asylum seekers that are accepted in each country from the refugee pool or the average number of years that each has been a refugee. This is a strong skill to have acquired. I easily can see so many possibilities for it.
Highlighting the Humane
Reflecting on the readings for this week, the point that kept coming up in my mind as I was reading the articles was how utterly humane the writers discussion was underlined. This was surprising by omission in the sense that it was something I had missed before their discussion. When thinking of an archive or a collection or a museum, the concept of humanness somehow didn’t cross my mind. Being aware of the horrors of slavery, I hadn’t thought of the point that an archive could perpetuate them. Reading Johnson’s Markup Bodies I became very aware of questions that need to be addressed while coming into contact with an archive. Questions of data stability, of data usage, and, of course, objectivity- something I was aware of previously. Data as Johnson states, ‘… has been central to the architecture of slavery studies and digital humanistic study.” Taking into account that data is not neutral allows me to have a critical take on what I’m looking at, very similar to the last set of readings which involved mapping. Neither can be taken as is. Even taking first hand experiential testimony can have a slanted point of view. Johnson notes, “ … an exploration of the world of the enslaved from their own perspective- served to further obscure the social and political realities of black diasporic life under slavery.” The tradition of data as ‘given’ or neutral has continued for quite a long time. Even up until recently, the concept of humanizing- I think of Drucker here- data is still resisted as Johnson mentions regarding the conference at the College of William and Mary. Her aim is to contextualize the data and to bring it home so to speak. To open up the database and allow it to be used by the community for the community’s well-being whether to remember, to pass on, or to help heal. It is this idea of it being a tool to heal that resonated with me and where I saw the archive being used by people, normal people rather than academics. Real world application to help real world hurts. Rather than just having numbers which can take away a sliver of humanity and obfuscate reality, we have a tool to do the converse of that.
The September 11 Digital Archive also showed healing as a component of its purpose. Brier and Brown showed tremendous insight in their approach towards the archive when they had an epiphany of being archivist-historians, the updated version of a historian- historian 2.0. Working very rapidly to collect as much input from as many sources as possible was an excellent idea to record things which were fresh in people’s minds. Creating webs by reaching out to other communities, whether ones with different languages, different locations, different geographies, was an enlightened approach. Giving ordinary people an input into the archive and allowing them to be represented gives people the opening to view/use the archive to remember, to heal. This is a major reason it’s one of the most visited sites.
Christen and Anderson articulate the view of an archive being a place to ‘decolonize processes’ as a ‘slow archive’ where data is preserved but more importantly where ‘we have to keep pushing forward to save the culture.’ By ‘pushing forward’ we can find solace in the wrongs of the past and, again, heal. A slow archive is, as others have noted, a place to pick up life experiences, oral stories, and in view of the Mukurtu CMS to have real healing whether recognizing tribal traditions or respecting tribal customs or allowing ‘temporal sovereignty.’ A slow archive is a recognition of the relationship between the archive and what the community needs.
This enlightened view of an archive is seen in different places. One such place is Pan Dulce: Breaking Bread with the Past. In creating the archive, Cotera not only created an archive but a template for others to use to tailor the archive to their unique purpose. For her, creating a feminist Chicana archive and the basic template for others to use consisted of 5 principles:
- Research grounded in a specific topic. For her own, it was Feminist Chicana History.
- Participants are co-creators and retain intellectual rights to their input.
- Relies on relationships of reciprocity, vulnerability and researcher reflexivity.
- Places lived experience at the center.
- Provides a potential space for healing.
Healing, again. So, from the readings, the insight that I come back to over and over again is of use, of use to heal. How powerful is that?! They are not places to only be academic, nor are they places to be dissected and analyzed, but places to learn and to heal, an active place to be pro-active. A place where one can ‘keep pushing forward.”
In essence, an archive must not just record data, but bear witness, and be a place to help heal.
Returning to Academic Writing Workshop
This workshop was given by the Writing Center as a guide for those as the name implies. The presenter gave some strategies for engaging secondary sources and for being on the ‘right’ side of an assignment. The presenter discussed the strategies on how to approach each either geared for a Master’s assignment or for a Phd dissertation. It was a helpful and blunt advice-driven workshop geared to making assignments a bit more focused for the environment. I have a copy of the handout of the strategies they discussed during the workshop if anyone is interested. Drop a note and I will forward it.
The Great Debate: Python vs R
I’ve been attending many workshops lately, and they have been very instructional. In the past week, I’ve attended workshops on Python and R, both coding languages. I am an absolute beginner and wanted to share my impressions with my class colleagues. Here it goes:
The Python workshop was geared to basic beginners which made it easy to follow along. The presenters were very helpful in assisting us in downloading the program and setting it up. Some of us had issues during the set-up process and were guided to a breakout room for individual help. Once done, we were given an introduction to the interface and some basic language prompts. Several of the prompts introduced were the comment prompt (#) to make a comment without executing an operation, print, which shows the item in question. There were several others. When I asked how this would be used for a project, I was asked to wait until the next session to get the answer.
The R workshop was pretty much similar in that it was geared for basic beginners and it was pretty easy to follow. However, the presenter started the presentation with finished projects, which gave an end point to focus on as an example. Again, we learned the interface and basic operations. However, with this workshop we downloaded data from the UN and worked on it, which helped solidify the concepts. Getting my hands wet so to speak made the learning stick more.
After attending both workshops, I’ve noted several slight differences. (Please keep in mind I’m an absolute beginner.)
Python seems to be the one to go to for big data analysis.
R seems to be the one to go for visualization.
Python seems a bit easier.
R seems to have a bit of a higher learning curve.
As to the debate, Python vs R?
Answer- Python & R