
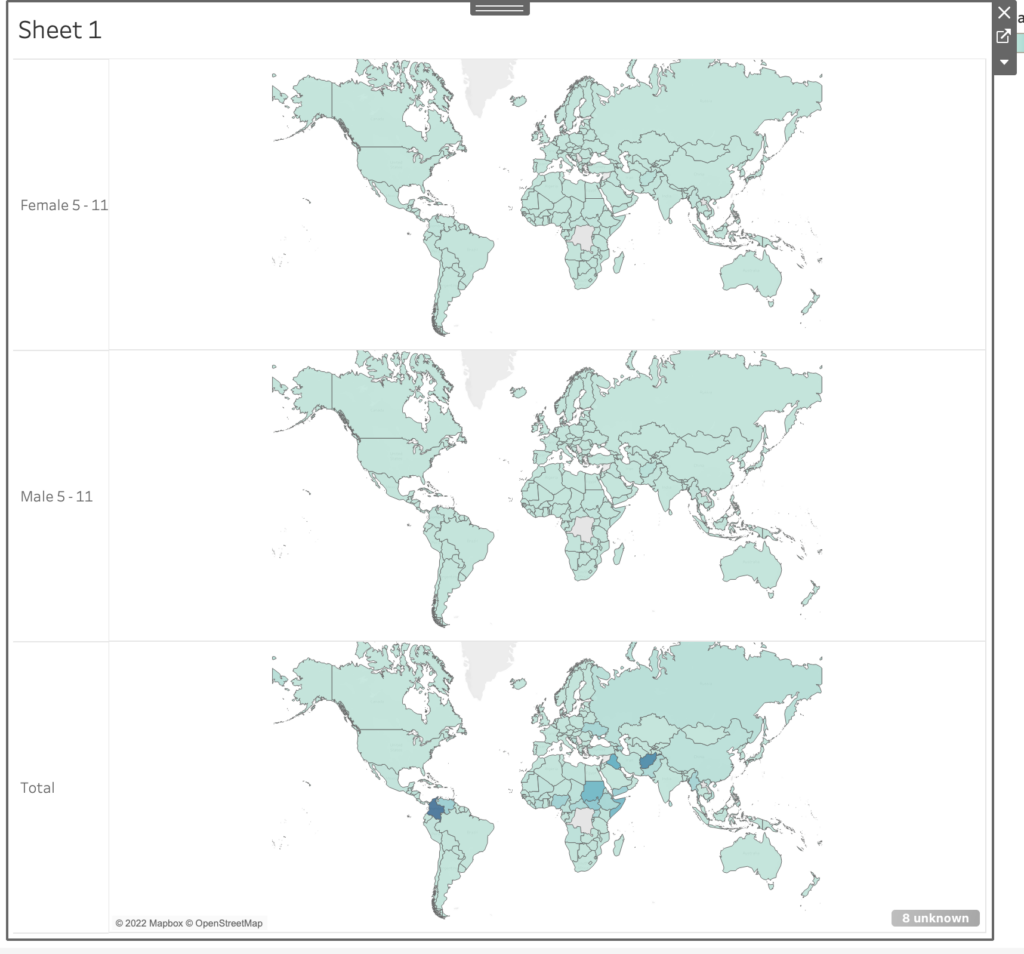
My mapping assignment has been a winding road passing many villages of programs to get to the goal of a map. When I first thought about the assignment, my first idea was to think of mapping the immigrant community in NYC by zip code with layers of supermarkets in each zip code with layers of farmers markets and community gardens in each area as well. The idea was to show the preponderance of food deserts. I started my journey by going to QGIS which I understood to be the standard. After an hour with the program, I realized that the learning curve was too steep for me. I went over to Google Maps, which was unappealing. I finally settled on Tableau. After watching about 6 YouTube videos on learning the basics, I felt I had an idea on how to proceed. I started looking for datasets to input or connect to Tableau. I ran into some issues as to finding the datasets I was looking for. Finding the data was challenging as there wasn’t one place for me to gather what I was looking for, so I decided to go to the UN as it was one location that was organized. I changed my topic to the number of refugees worldwide and downloaded datasets about that. The dataset was overwhelming as it spanned years and had a very large subset of categories. I tried to work with what I had but ran into many issues. I even stripped the data to only include one year but still got stuck on how to proceed. This is when I reached out to Filipa who was extremely helpful and patient. She said she would learn Tableau to help me out! Something I said would not be really necessary as I can ask for another tutor, but she did it anyway. Not only that, but she went to the UN site and retrieved a dataset that was much more different than mine. What she showed me was that my original dataset was incomplete in some ways and too much in other ways. She also showed me how to be extremely selective in choosing the dataset for mapping. From there, she helped me to fine tune the map I started with. This became the present map that I share with the class. It is a map, actually 3, of refugees in the world in 2021: 1 is the total number in each country; one is the number of females 5-11 years old; one is the total number of males 5-11 years old; and the last one is the total number of all refugees. It was exciting to finally get a finished project. Although it may be finished for the assignment, I’m intrigued to see how I can add one or 2 more layers to the map. Perhaps the number of organizations helping in each country or the number of asylum seekers that are accepted in each country from the refugee pool or the average number of years that each has been a refugee. This is a strong skill to have acquired. I easily can see so many possibilities for it.

This entry is licensed under a Creative Commons Attribution-NonCommercial-ShareAlike 4.0 International license.
Thanks for sharing JP, this is a topic I have been looking at in another class that I take – Quant Methods for Social Scientist and Humanist. Would be happy to attempt to pull some data from IPUMS on refugees if that would be helpful. I also attended the Student Portfolios on the Cuny Commons workshop today and Anthony who lead the workshop created a mapping immigrant resources portfolio, here is the link : https://mappingimmigrantresources.commons.gc.cuny.edu/