Author Archives: RC

Final Project Overview – Energy Consumption Map

In this blog post, I’d like to share my idea for the final project, which would be a grant proposal.

Name: Renewable Energy Consumption Forecast Map (still WIP!)

Product format: Website with an interactive map

Abstract: The grant proposal for building a web app hosting a dynamic and interactive map that shows energy consumption forecasts. The website will also include basic calculations and simulations to help consumers estimate energy usage, cost, and credits.

Context: One of the key challenges for transitioning from fossil fuel to renewable energy is managing the energy grid (as supply and demand fluctuate). Fossil fuel supply can be very predictable (you can burn as much as you need). Unlike fossil fuel, Renewable energy (along with the storage challenge), there’s kind of a “cap” on production. The only way to increase production is to have more hardware such as solar panels (which we must remember they not that sustainable to begin with, it also doesn’t make sense to have 100 additional solar panels just to cover the peak usage of 2 summer hot days).

Problem Space: Managing supply and demand for renewable energy

Why does this matter: Managing supply and demand in an agile manner is obviously necessary for fossil fuel to the renewable energy transition. However, doing it in a socially-just manner could be pivotal in rebalancing power between the energy companies and the consumer. Considering Environmental and Climate justice tends to distribute both advantages and disadvantages unfairly to marginalized communities. This is important to keep in mind that we should not simply aim to transition from fossil fuel to renewable energy, we also leverage this moment to address environmental and climate injustices. After all, it will be unfortunate if we do successfully transition away from fossil fuel, but all the energy companies are still in a position of power that would allow them to place profit before people.  

Current solution: Consumer-facing levers for demand management: Increase pricing to reduce demand (aka peak hour surge pricing)

Proposed additional solution: Incentivizing households to reduce electricity usage at peak times when demand is at its highest, by offering energy credits or cash rewards. The rationale behind this idea is that households should get “rewarded” for saving energy during these peak hours and thus make them more available for the rest of the grid.

What do we need to make it happen: Transparency of energy usage as a foundation of information sharing and a place to tackle market dynamics where incentives can be mobilized –> a website with energy consumption and reward calculator.

Pedagogy Readings & Class Discussion

This week’s reading and discussion introduced some interesting thought-starters for me. Highlighting a few to share here:

  1. Per “How Not to Teach Digital Humanities”, DH is not suitable for undergrad students due to the theoretical component. I thought this was interesting and was wondering if I were to take this class in undergrad, what would that be like? I am still navigating my perception of the DH field as this is my first DH class. It is indeed more theoretical, and less technical than I expected. I do enjoy the critical components of it but do crave more resolutions/ applications.
  2. During the last class, it was discussed that “humanities studies don’t solve problems, but rather post questions to those problems”. This jumped out to me and definitely got me thinking. I studied BBA (business) during my undergrad studies and have always been in a “problem-solving” role since I joined the workforce (management consulting, corporate finance, data science, etc). This was definitely a shocking and liberating revelation that I was not expecting. In the professional context, I operate from a problem-driven mindset (as opposed to a solution-driven mindset). While it is still a problem-space operating mindset, the goal is simply to ensure we are working on the right problem before we dive into solution-ing. “Posting/ asking questions without the intent of solving the problem” is definitely something I have never considered before. I am not sure how I feel about it yet, but this is definitely an interesting mental experiment.

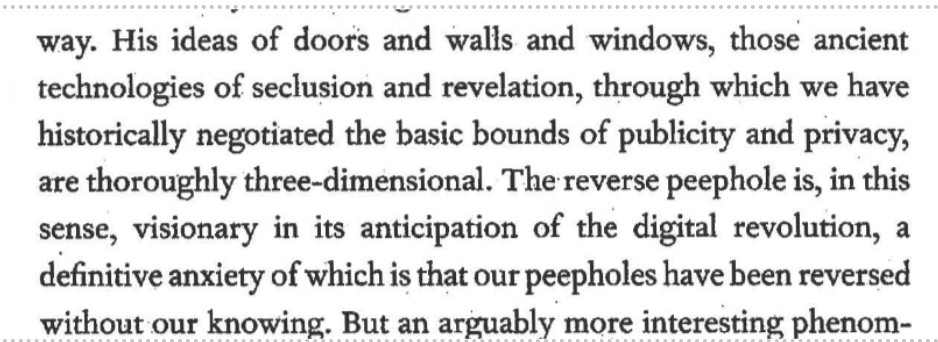
Annotations to The Four-Dimensional Human

Annotation/ Discussion :

  • What are some other terms that are related to the “reverse peephole” concept described above? (e.g. digital surveillance)
  • How have/ will these “reverse peepholes” manifest under different social structures? (e.g. capitalism vs. Political paradigm) 
  • What are some key issues and concerns around these “reverse peepholes”? What are the pros and cons, and trade-offs of it?  
  • What conditions/forces enabled the expansion of this “reverse peephole” landscape, under the age of digital surveillance? Who/what was fueling it? Who is pushing back and how? 

[Bonus] Check out these books if you’ve enjoyed this reading:

  • Homo Deus: A Brief History of Tomorrow (written by Yuval Noah Harari) 
  • The Three-Body Problem (science fiction novel written by Liu Cixin) 

Comment

I have really enjoyed this reading as it is beautifully written and touched on some interesting ideas with a solid yet palatable perspective. Considering we only read a small part of the book, I did not feel 100% ready to annotate for this Praxis Assignment as I feared the rest of the book might go in other directions which would make the annotation confusing/irrelevant for the students in the other class.

However, keeping that thought aside, my immediate thoughts were books that this reading reminded me of. I added their titles in the bonus section because I didn’t think it’d be fair for all students to research/ read these not-so-short books. I do however want to share them as I find them relevant and interesting.

I ended up annotating around one key phrase (“reverse peephole”), as it really captured my attention during my reading. I offered some discussion questions for the students to engage with this particular idea in the text.

Text Analysis Assignment (Voyant + Google Ngram)

As a data scientist, I have done many NLP projects at work. I mostly work in a Jupyter Notebook python environment and leveraged common NLP libraries like NLKT and Spacy. My usual NLP project mostly consisted of cleaning and structuring data (lemmatization, stop words, n-grams, tokenization, etc.) and running clustering models on them (usually LDA – Latent Dirichlet Allocation).

I have not heard of these tools and am excited to try them out as this is very different than my regular workflow. I have explored a few tools but will share my experience with two in particular below. 

Voyant

Back in 2019, I started a personal NLP (Natural Language Processing) project but never finished it. As a quick recap, I was just looking to explore a lyrics data set. I picked Lana del Rey because I had been listening to her frequently back then. I tested gathering lyrics by web scraping and API (with AZ Lyrics and MusicMatch respectively). I was able to query lyrics from MusicMatch’s API after many trials but only to find out the “Free API” version only offers 30% (or the first 30 lines?) of lyrics per song. For this praxis, I was hoping to use this old dataset that I have gathered to explore tools mentioned in the guidelines. Unfortunately, I didn’t save the text anywhere and the code I wrote is outdated so it will require plenty of effort to refactor the code.  

In the end, I have decided to use Taylor Swift’s latest album, Midnight (3 am version), instead. I have been listening to this album recently and so am familiar with the lyrics. I ended up just copying and pasting the lyrics from a site manually as it is the most straightforward.  

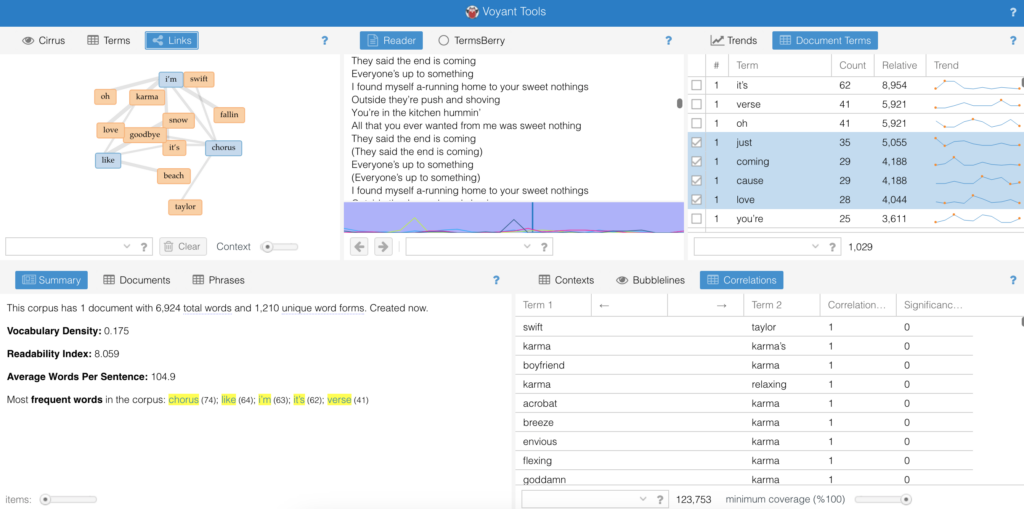
I pasted the lyrics into the web interface and explored the web took quite a bit. I don’t find the output particularly helpful. I believe it is due to both lack of processing (e.g., data cleaning) as well as the nature of this text corpora. Here’s a screenshot of what I am seeing. I was unable to draw any insights. However, I was impressed by how easy it was to just paste in text, and all these features are automatically generated. 

Google Books Ngram Viewer 

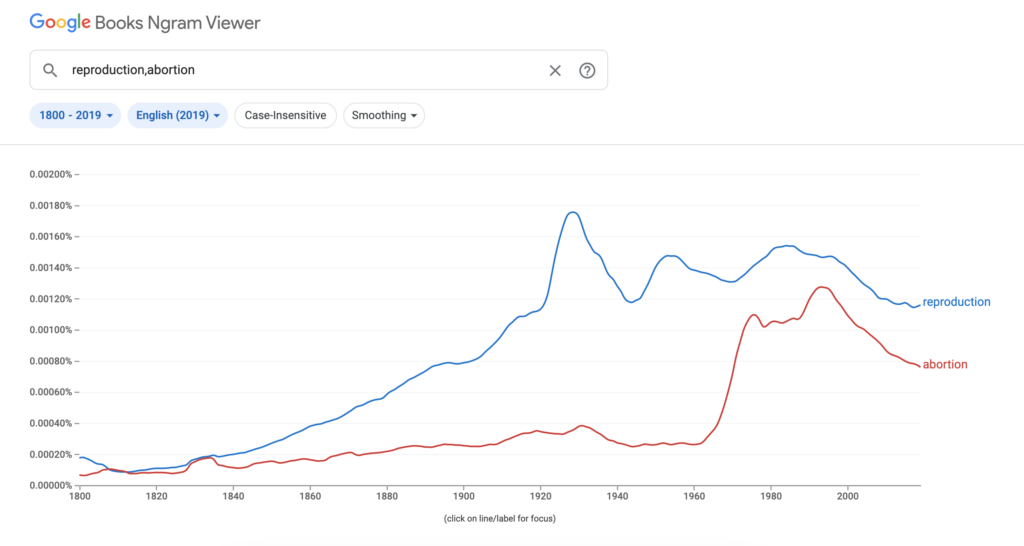
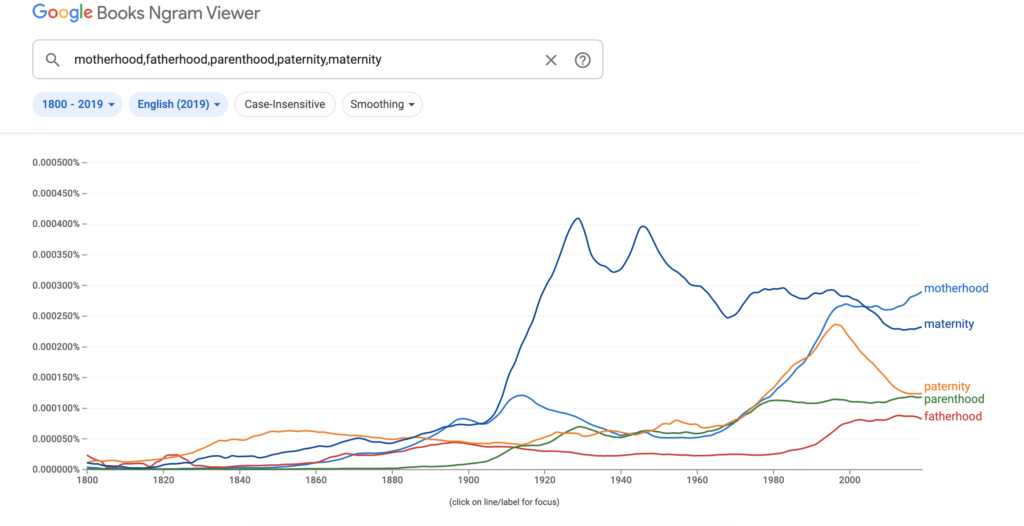
I have never heard of this tool before. From the name “n-gram”, I had the wrong assumption about what this tool does. It appears to be like a google trend product but related to google books content, which I thought is helpful. I have always been interested in gender disparity in many aspects of life, so I explored different keywords. Sharing two comparisons below: 

Workshop Overview: Impact Factor and Other Research Metrics

I attended this event about “Impact Factor and Other Research Metrics: What They Mean and What They Don’t” by Jill Cirasella (Associate Librarian for Scholarly Communication). While I have not written any formal article yet, I have always been curious about citation and their “importance” ever since one of my former work colleagues who had a Ph.D. once told me his paper finally got cited 100 times (which apparently was an exciting milestone).  

This workshop gave a wonderful overview of the context of key citation metrics and how problematic they might be. The metrics discussed include: 

  • Article Metrics (aka how many times an article had been cited) 
  • h-index (largest number h for which the author has published h articles that have each been cited h or more times.) 
  • Journal Metrics (What is the journal’s Impact Factor?) 

I also found the discussion around citation gender gaps interesting, here’s a quick summary: 

  • Men cite men over women. 
  • Mixed-gender co-authored papers cite men over women. 
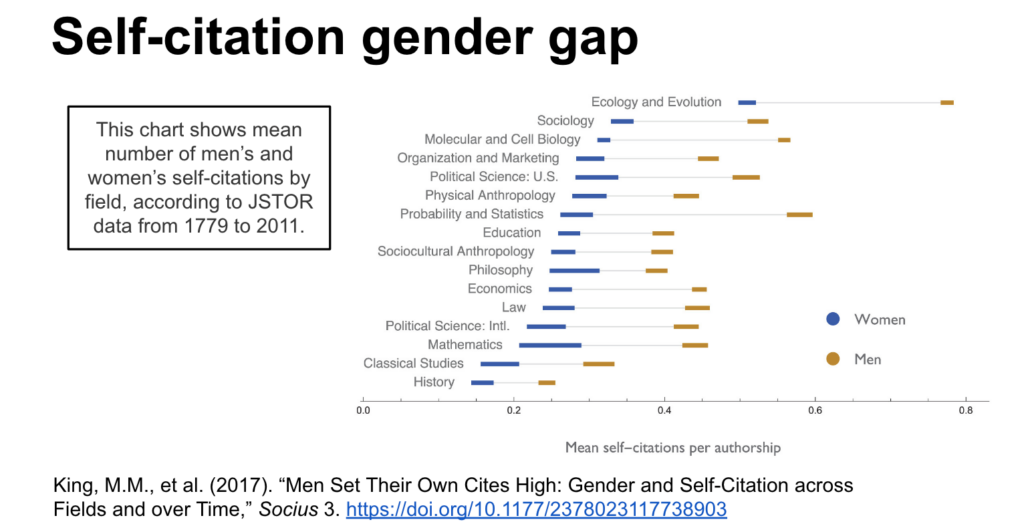
  • Men self-cite more frequently than women do…even in fields with the majority of women authors.  
  • In fields that are trending toward more women authors, no corresponding trend toward citing more women. 

Interesting Visual: It was discussed in the workshop how metrics could be “gamed” by a scholar. The following shows male scholars are way less shy about self-citing their own work (which will boost their metric), which contributed to the citation gender gaps. 

If you are interested in the workshop but didn’t get to attend, you can check out their: 

Weekly Readings Responses – Beyond the Hashtags

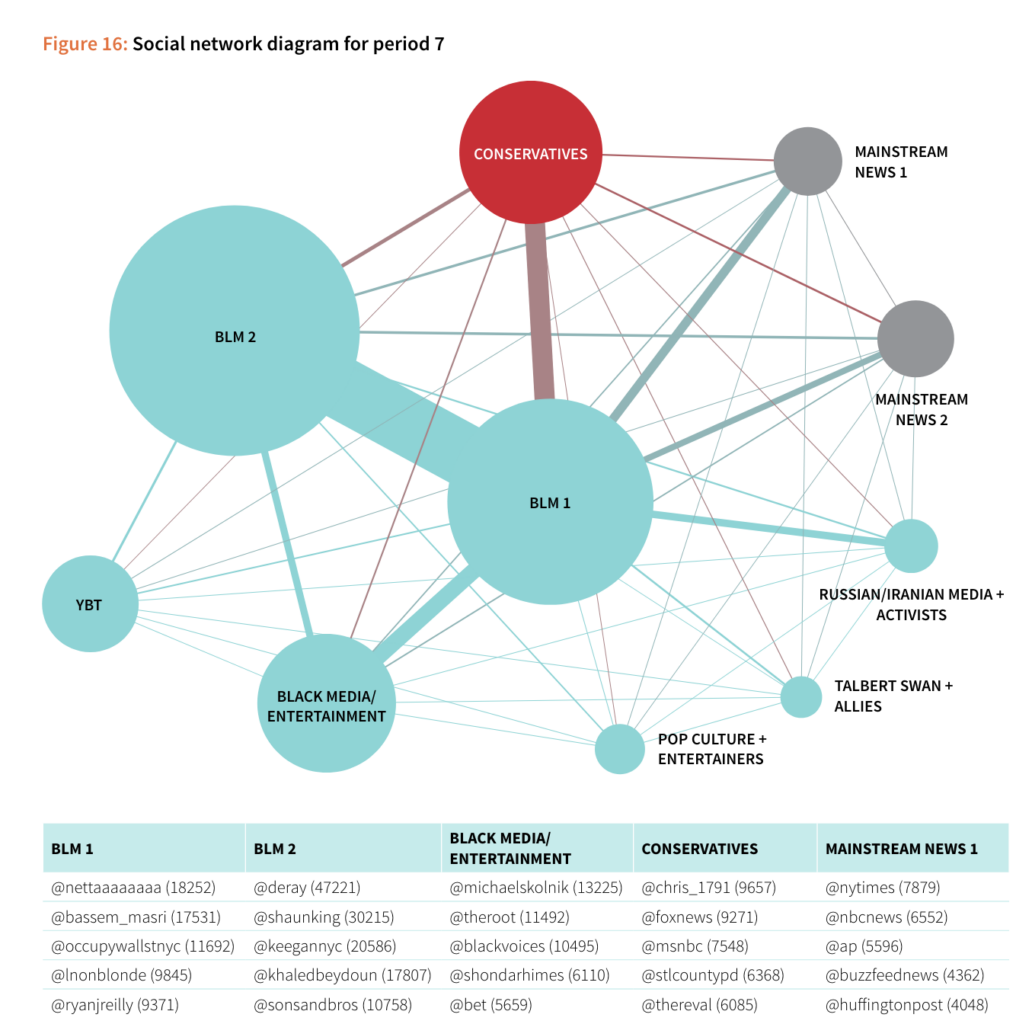
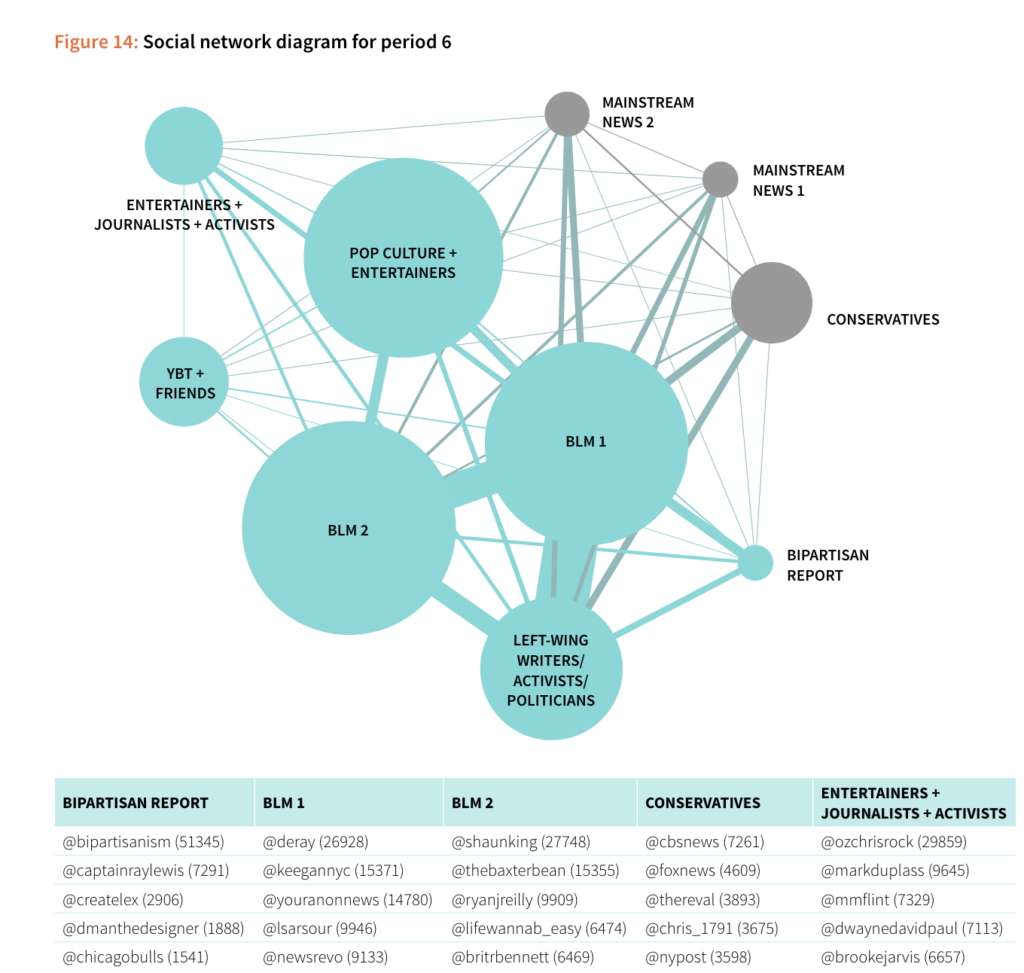
I have really enjoyed the “Beyond the Hashtags” reading this week:

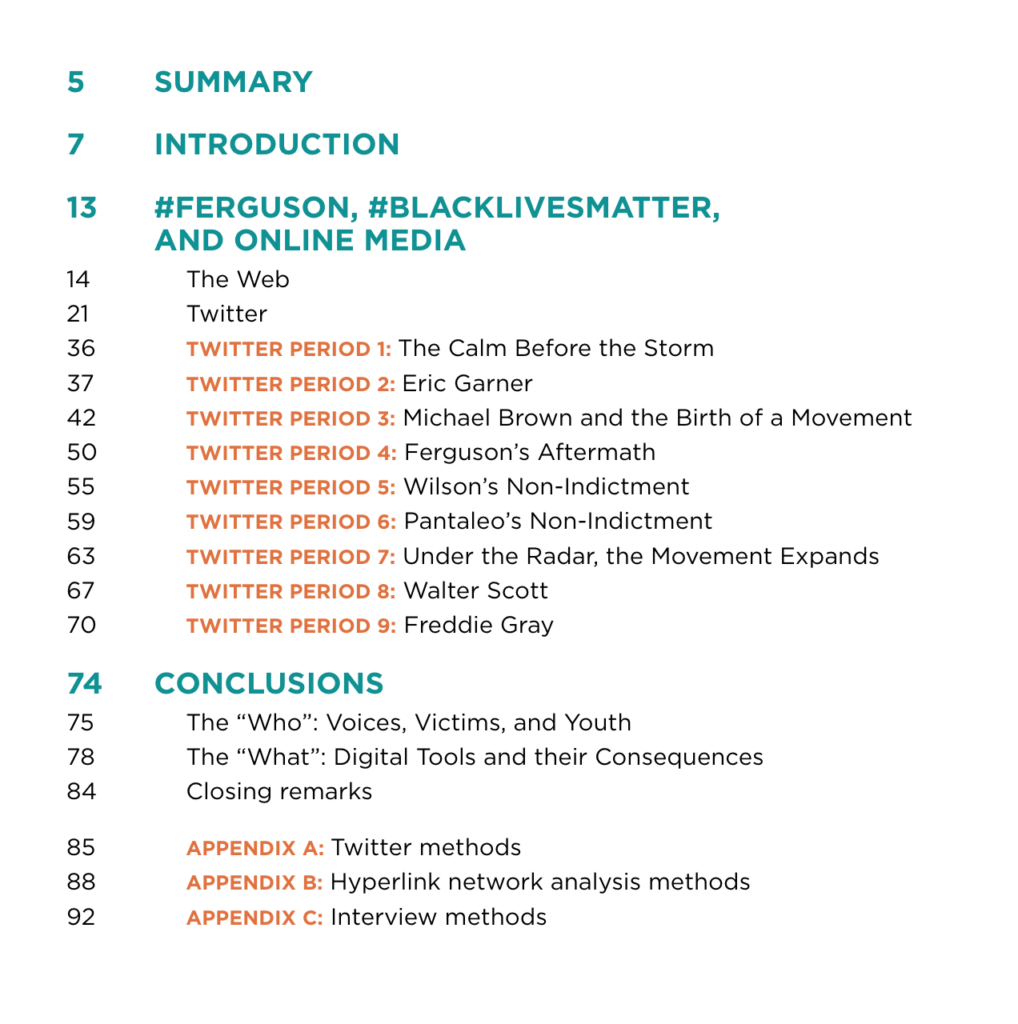
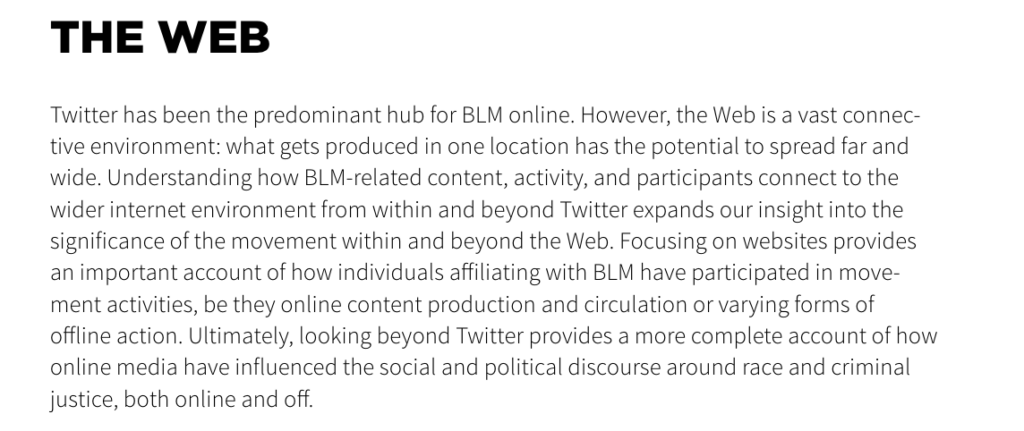
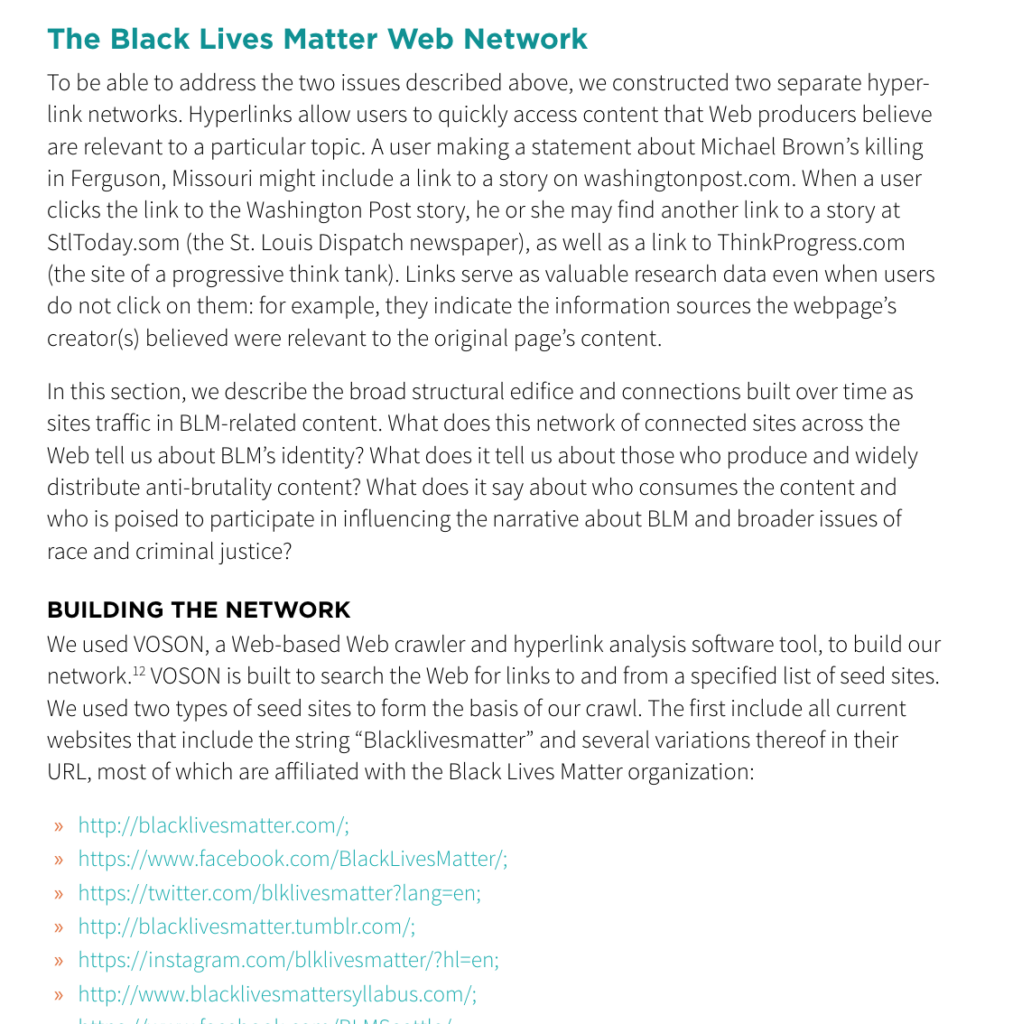
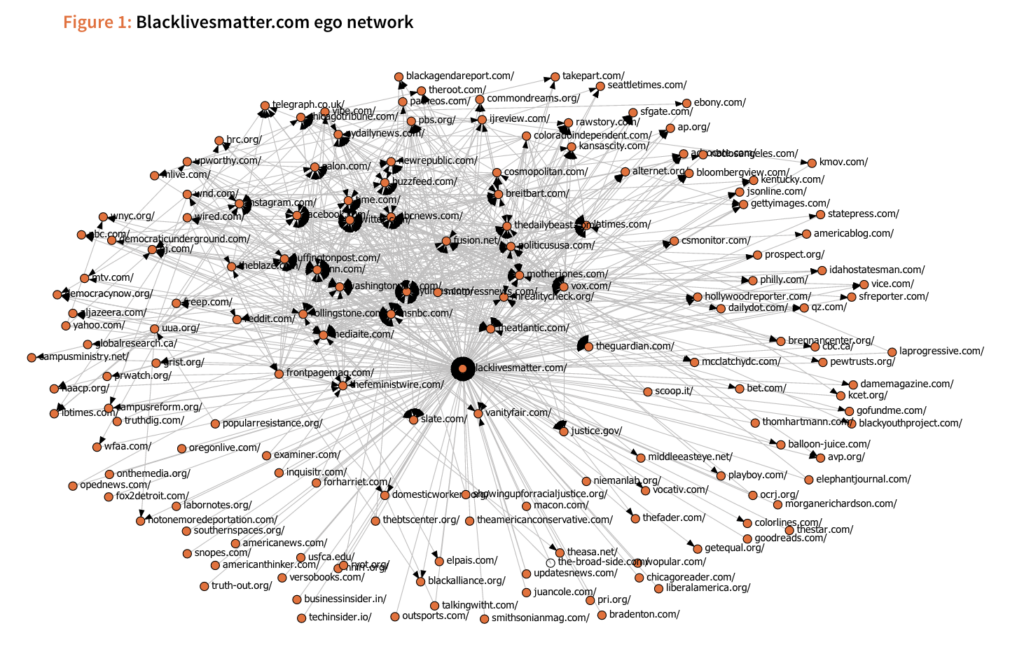
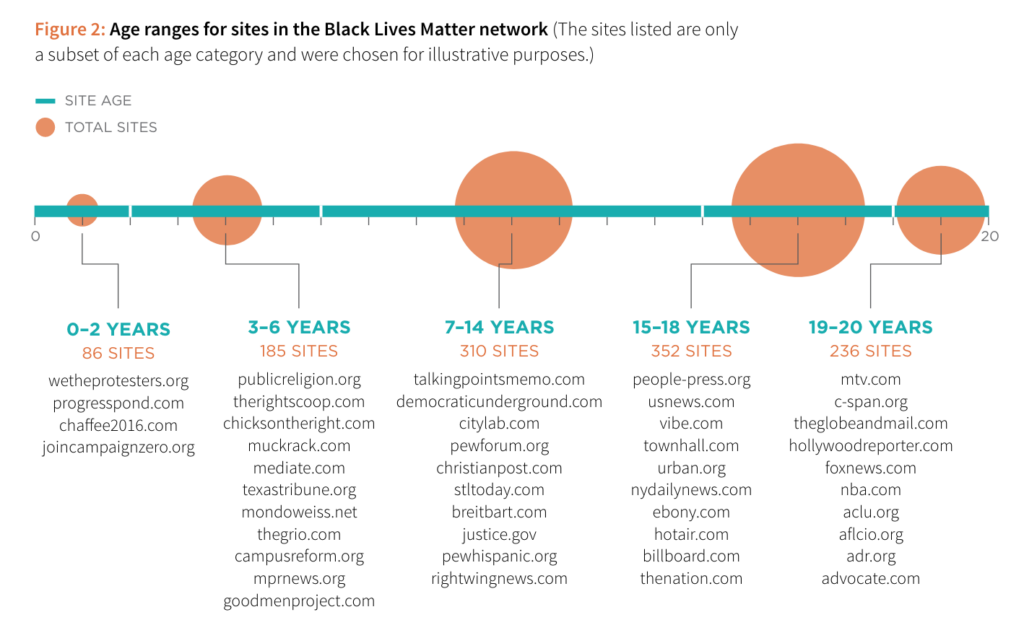
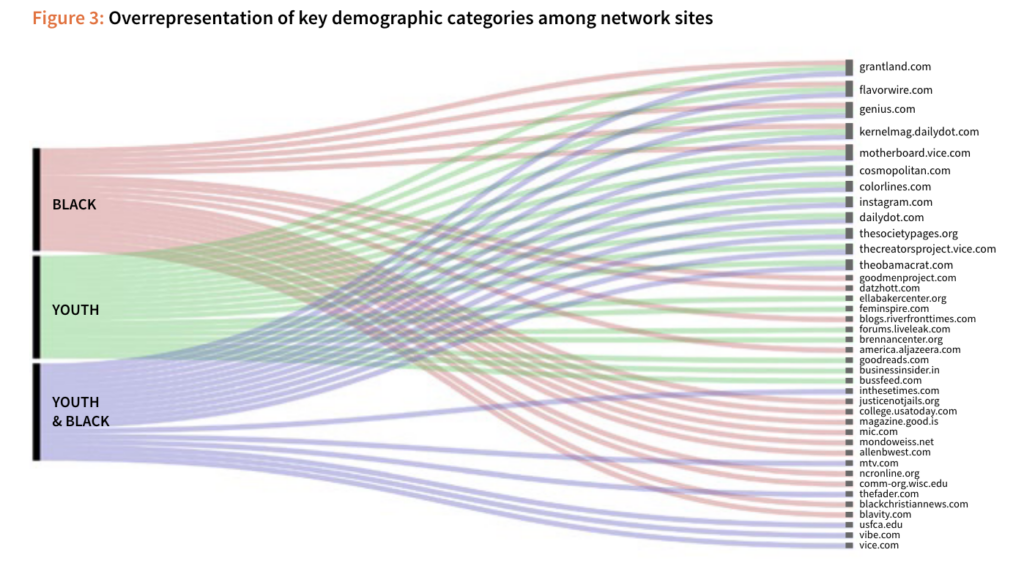
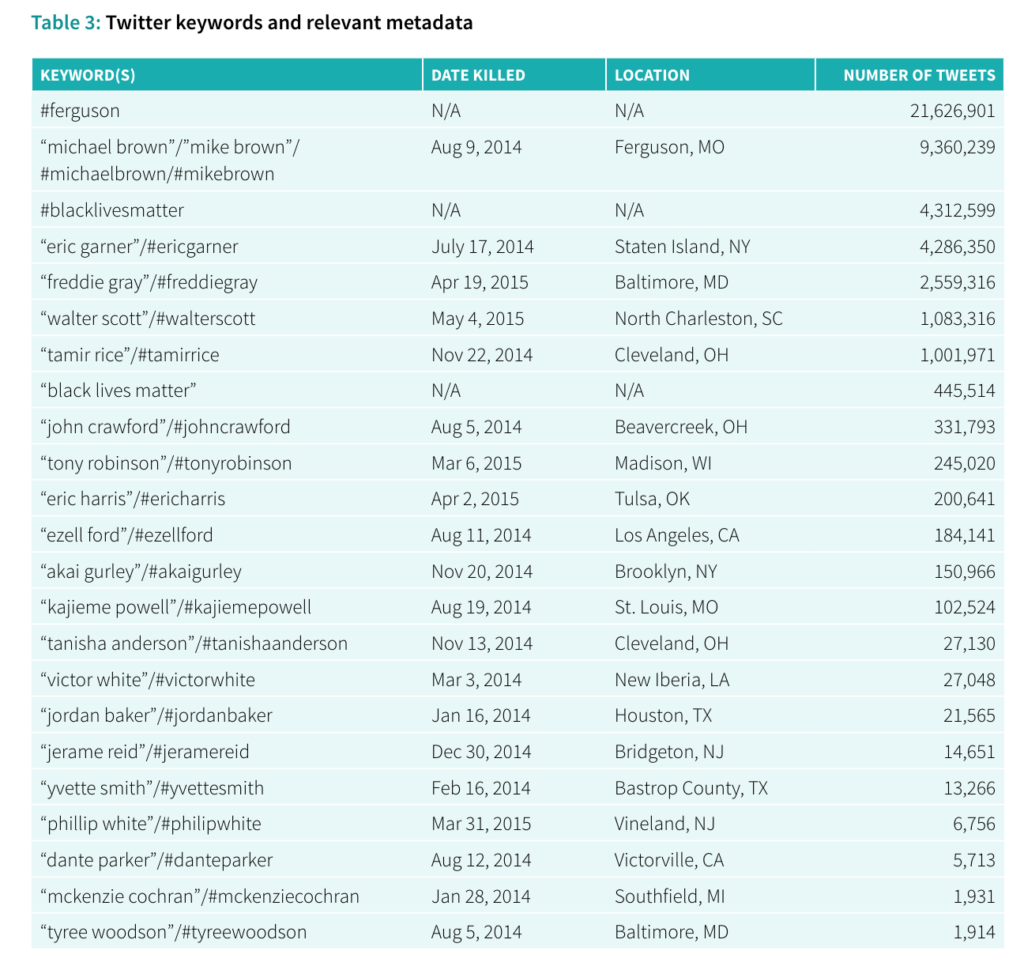
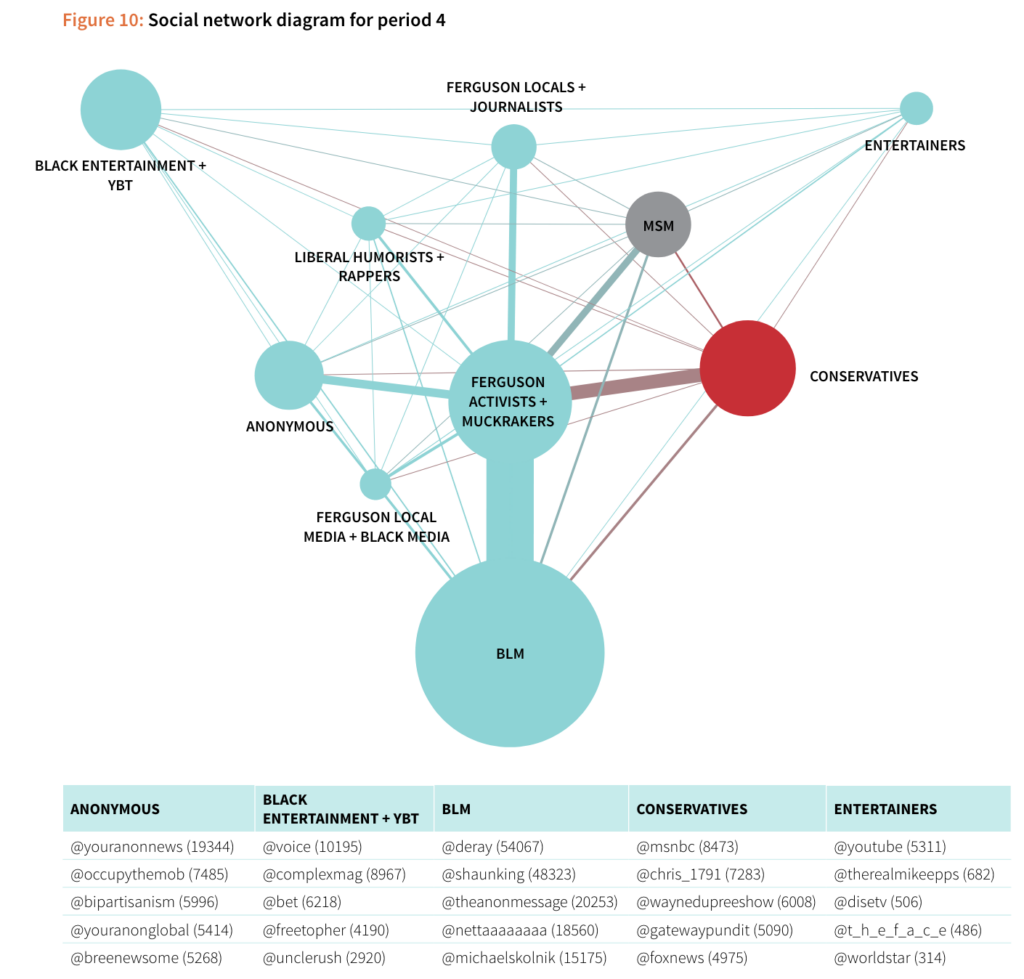
While I have enjoyed many readings this semester, I do find a lot of them written in the “academic style”. It is refreshing to find readings that express a similar amount of information and critical analysis but in a way more reader-friendly format. I took some time to think about what made this reading so much more digestible and engaging than other readings (in terms of format, not content-wise) and want to share my observations below:

  1. The chapter outline gave me an overview of what I should expect, as opposed to much academic writing, I have re-read the writings a few times and “do the work” to figure them out.

2. The information hierarchy is extremely clear with the use of font size and font color

3. I find the visualization very easy to interpret and done “just right” (in terms of size, color, design, information density, etc.). All charts are clearly titled, annotated, and explained. Note: I have very familiar with these chart types, to begin with, so I already know how to “read/ interpret” them.

4. Tables are utilized to express the right amount of information, sorted logically and stylized in a way that’s easy for the eyes.

5. Chapters on Social diagrams leveraged a consistent form, making it easy to follow without doing a lot of brainwork to digest.

PRAXIS Mapping: Riparian Birds – Sierra Nevada Foothills

Context 

For my PRAXIS Mapping assignment, I have visualized a bird sampling dataset that I’ve found from the government’s open data website, data.gov.  

About the data 

A little bit about the dataset, published by the California Department of Fish and Wildlife: 

“These data are summary statistics of abundances of birds counted within 100-m radius circles with 10-minute point counts at multiple sample points along 36 randomly selected watercourses in the foothills of the Sierra Nevada Mountain Range. Bird surveys were conducted between 25 March 2005 and 30 June 2005 along watercourses from Butte to Calaveras counties. These data represent 2,614 detections of 94 species at 144 different sample points along the 36 watercourses.” 
 

Here are some pictures of Riparian Birds.  

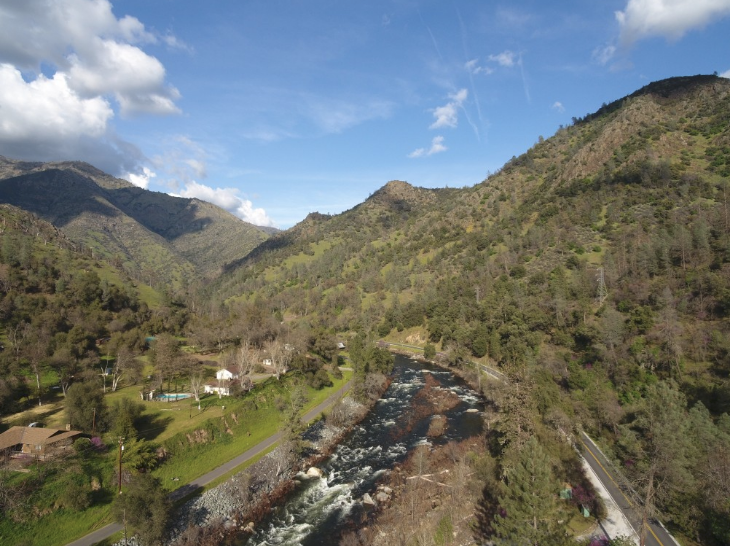
And a picture of Sierra Nevada Foothills:

Mapping exercise 

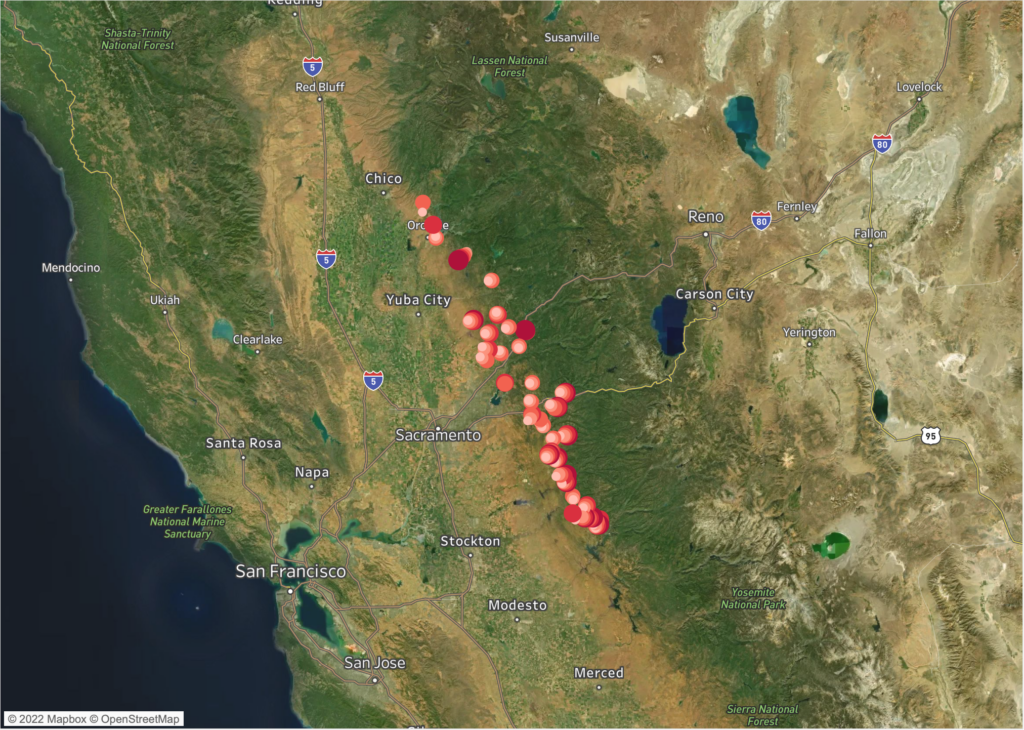
I have selected the Tableau desktop tool considering it’s versatile, free, and available for Mac computers. The dataset is rather short and simple, it provides latitude and longitude coordination along 36 randomly selected watercourses in the foothills of the Sierra Nevada Mountain Range. This limited what I can do with the mapping visualization exercise. I first transformed the lat and long columns from the CSV dataset into Tableau’s geographic role data types. Then, I dragged these values to the X axis (columns) and Y axis (rows) respectively. I then dragged in “the count of sighting of the birds” with the “option” key down to express the sum of this variable. Then I played around with the mapping configuration to determine what map visual to show (satellite images, highways, city mapper, etc.). Lastly, I changed the scale and color of the data point to make them more prominent and legible.  

See below for the output: 

Week 1: To what extent do these sites/projects reflect issues discussed in our readings?

Sitesissues discussed in our readings reflectedHow would DH be defined in these projects?
Torn Apart / Separados– Intersectionality  
– Political commitment (against state-authorized violence) 
– MEALS framework 
– Peer review process 
“DH leverages digital tools (such as data and mapping) to advocate for social justice.” 
The Early Caribbean Digital Archive – The Digital Black Atlantic 
– “Memory and re-memory” 
– Library collection development 
– The reproduction of lost texts but also in the remaking of the history of Black textuality itself 
– Models of cataloging archives 
– Community archives  
– Pedagogy 
“DH cultivates collective cultural memory and re-memory by developing a library collection of early Caribbean texts, maps, and images archives.” 
Colored Conventions Project – (Everything listed under “The Early Caribbean Digital Archive”) 
– Intersectionality   
– Institutional concentration in well-funded research universities. 
“DH uses inclusive partnerships to locate, transcribe, and archive the documentary record related to this nearly forgotten history and to enable learnings” 
Reviews in Digital Humanities – Peer review process 
– “Who’s In and Who’s Out.” 
– Digital humanities community 
– Academic publishing vs. digital projects vs. Pedagogical  
“DHs are tool-building projects that facilitate the scholarly evaluation of digital humanities work and its outputs.”