
Context
For my PRAXIS Mapping assignment, I have visualized a bird sampling dataset that I’ve found from the government’s open data website, data.gov.
About the data
A little bit about the dataset, published by the California Department of Fish and Wildlife:
“These data are summary statistics of abundances of birds counted within 100-m radius circles with 10-minute point counts at multiple sample points along 36 randomly selected watercourses in the foothills of the Sierra Nevada Mountain Range. Bird surveys were conducted between 25 March 2005 and 30 June 2005 along watercourses from Butte to Calaveras counties. These data represent 2,614 detections of 94 species at 144 different sample points along the 36 watercourses.”
Here are some pictures of Riparian Birds.


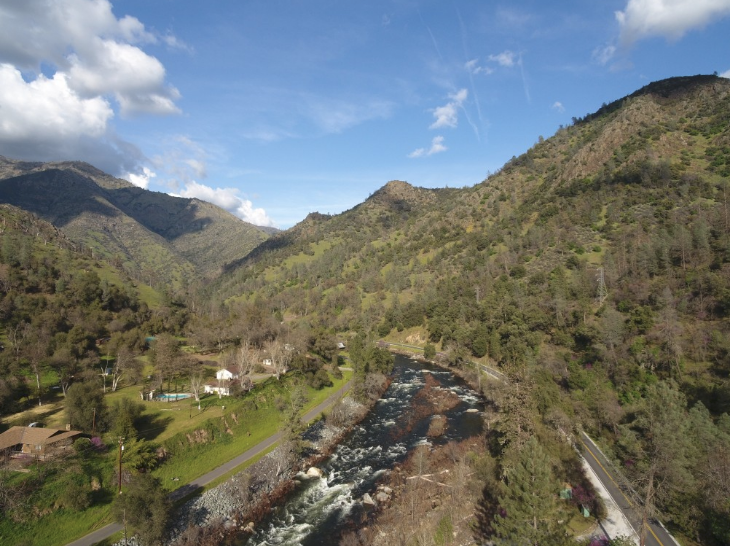
And a picture of Sierra Nevada Foothills:
Mapping exercise
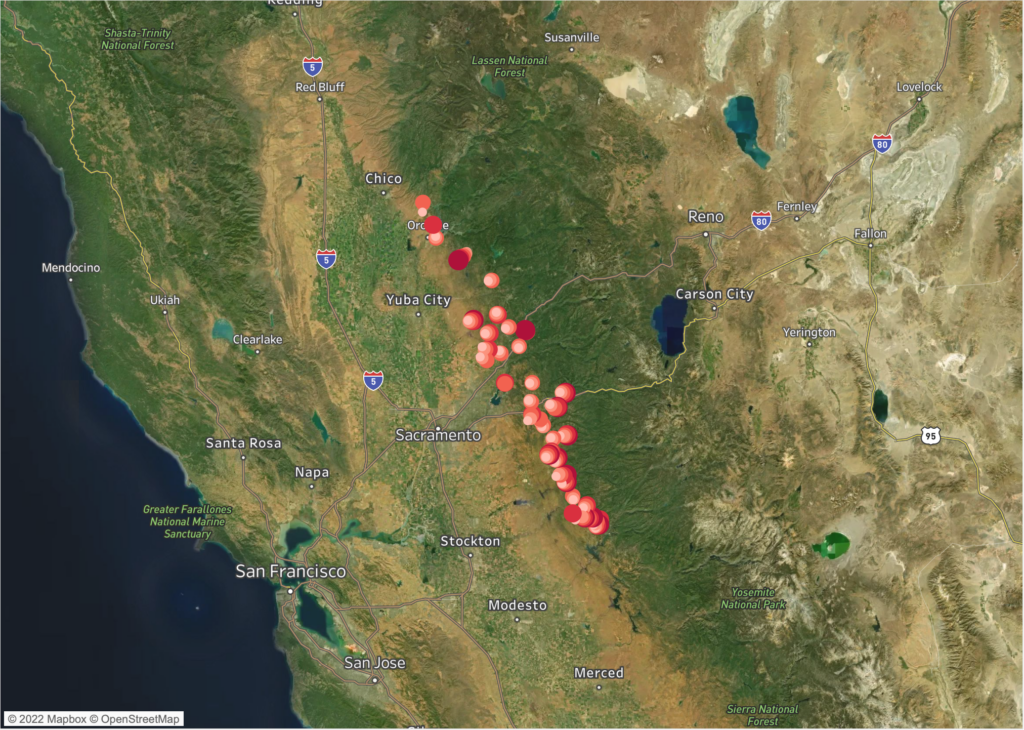
I have selected the Tableau desktop tool considering it’s versatile, free, and available for Mac computers. The dataset is rather short and simple, it provides latitude and longitude coordination along 36 randomly selected watercourses in the foothills of the Sierra Nevada Mountain Range. This limited what I can do with the mapping visualization exercise. I first transformed the lat and long columns from the CSV dataset into Tableau’s geographic role data types. Then, I dragged these values to the X axis (columns) and Y axis (rows) respectively. I then dragged in “the count of sighting of the birds” with the “option” key down to express the sum of this variable. Then I played around with the mapping configuration to determine what map visual to show (satellite images, highways, city mapper, etc.). Lastly, I changed the scale and color of the data point to make them more prominent and legible.
See below for the output:

This entry is licensed under a Creative Commons Attribution-NonCommercial-ShareAlike 4.0 International license.