State and Federally Recognized Native American Nations in NYS
About this Map:
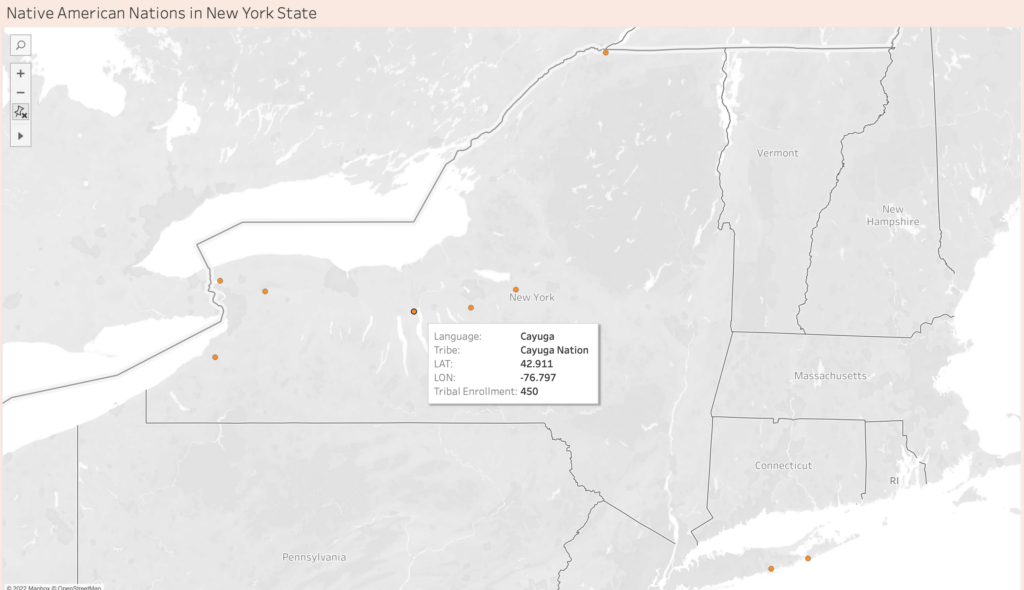
This map represents the nine state and federally recognized Native American Nations in New York State. On this map, I also include the language they speak and the total enrollment number for each tribe. The Tribal Enrollment Number was based on the tribe’s websites.
In recent years, I’ve been interested in learning about my roots and ancestor. When I received my DNA results from Ancestry DNA, I was excited to learn where my bloodline came from. I always knew I had indigenous DNA since I was born in Nezahualcoyotl, Mexico. However, when I read that I had 68% Native American DNA from Central Mexico and 1% Indigenous Americas—Panama & Costa Rica, I felt a new sense of pride and identity. In my family, we never spoke about being indigenous or Native American. However, we embraced our culture and heritage. In the same sense, I felt I had the duty and curiosity to learn more about the Native Americans living in New York State and the Americas.
I could not get the total enrollment for Onondaga Nation and Tuscarora Nations since it was not on their website.
I did not know how to read the My Tribal Area website (United States Census Bureau), since the population included people not enrolled in the tribe. Based on the articles above, I don’t know if I can trust this website to represent tribal information.
Lack of time to learn Tableau
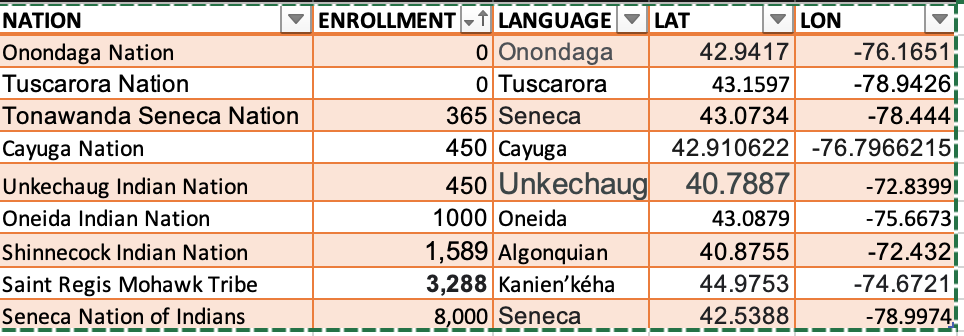
Data
Data table
My Questions
Who decides that a Native American Nation is recognized (state and federally)?
Why is there limited information on Tribal Enrollment?
Why are some Nations hesitant to partake in the Census?
What other Nations are in NYS that are not state or federally recognized?
This week, I attempted to map the works of two chroniclers of Gilded Age New York: Edith Wharton and Jacob Riis. Both offered clear-eyed critiques of the city and its people, and together they represent the duality inherent to the idea of a Gilded Age. Wharton’s novels describe the thin ornamental gilding that conceals the truth about a society; Riis’ journalism and photography deal with with what’s rotten underneath. Wharton’s critique is cultural and relatively narrow: the shallowness of the rich and the rigidity and provincialism of their customs and mores. By contrast, Riis’ critique is material, and his focus on the indigent is an indictment of the wider social and economic structures of late 19th century New York.
To create my map, I chose to use Tableau. You can see a draft of it here, on Tableau Public, as well as in the screenshots below.
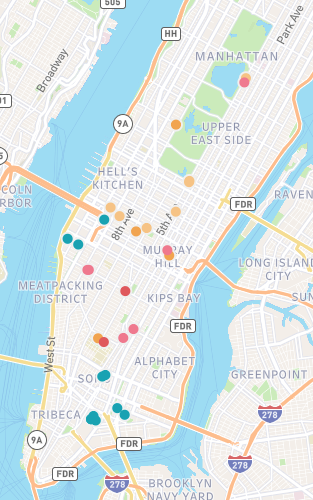
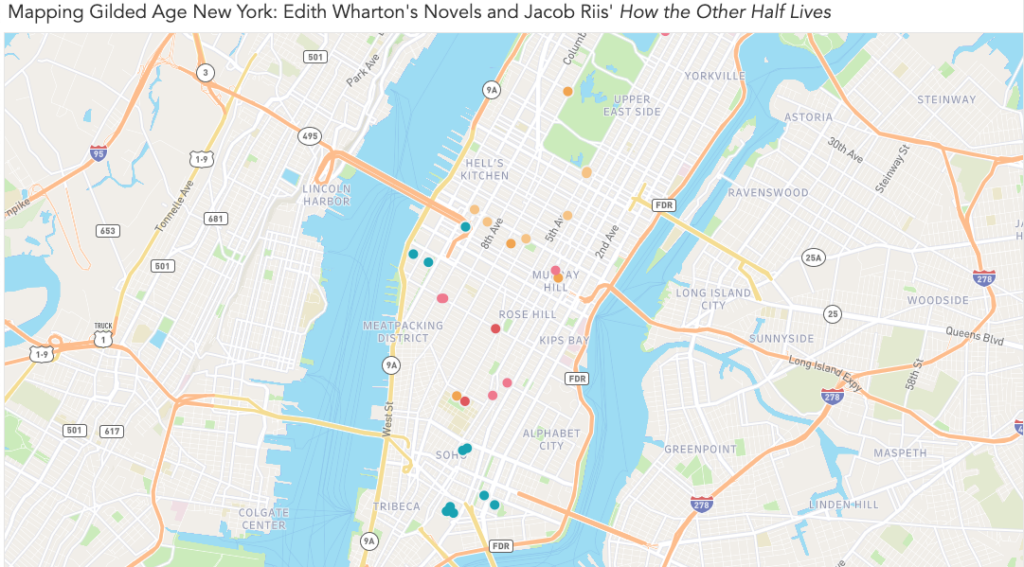
View of the entire map. Locations from Riis’ How the Other Half Lives are in teal, while Wharton’s novels are represented by various warm shades.Each marker expands into a note that contains information about the author, source, and location, as well as an excerpt from the relevant text and interpretive notes. In the notes, I attempted to give context about the source material and explain my methodology for determining the location.
Goals and Inspiration
I chose to map Wharton and Riis after a visit to the Tenement Museum last month. I’ve read three novels by Wharton in the past year, and while I’ve always been moved by the photography of Jacob Riis, I hadn’t consciously connected their work until paging through a copy of How the Other Half Lives while waiting for my tour.
The title alone is pointed, and I couldn’t help but think of Riis directing it toward New Yorkers who resemble Wharton’s characters. They possess such precise, detailed knowledge about the rules of their own limited world, yet show so little curiosity about what exists just out of sight. By mapping sites from Wharton’s novels and Riis’ journalism, I hoped to see just how closely these worlds were situated.
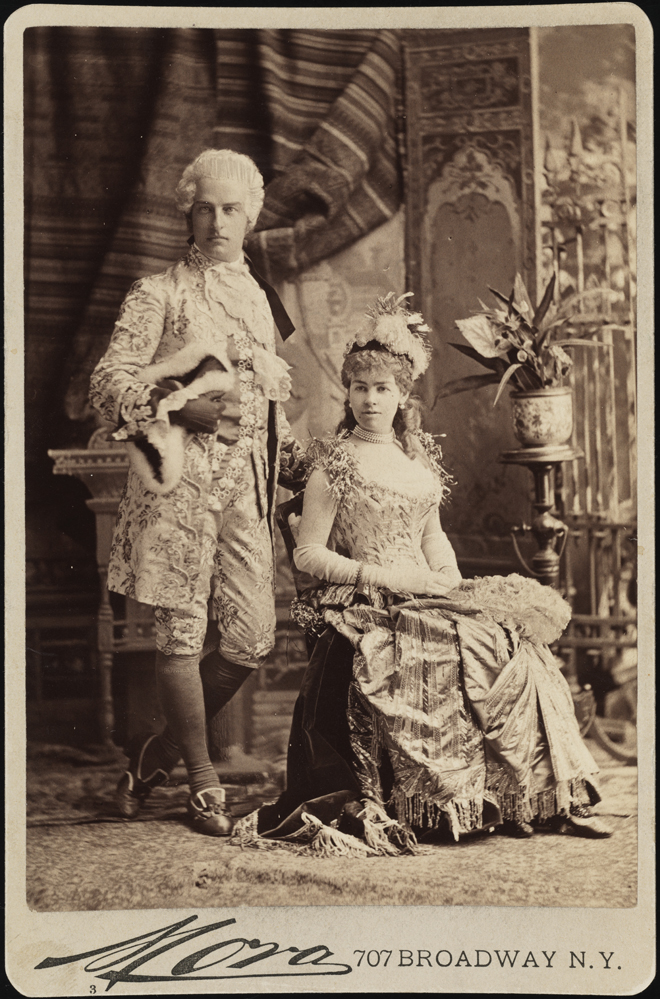
Mora (b. 1849). Mr. and Mrs. Cornelius Vanderbilt II (neé Alice Claypoole Gwynne). 1883. Museum of the City of New York. F2012.58.1341. https://www.mcny.org/story/vanderbilt-ball
I was particularly interested in spatially distinguishing the “genteel” poverty experienced by some of Wharton’s characters from the desperate circumstances Riis documented. For example, Wharton’s The House of Mirth tells the story of Lily Bart’s gradual fall from “high society” to poverty and obscurity. When Lily, finally broke, moves to a boarding house and works in a small workshop making hats, just how far is she — economically, socially, and literally — from the immigrant garment makers in the tenements of the Lower East Side?
My initial plan was to overlay locations from Riis and Wharton with demographic information from the time, such as population density, income, family size, etc. I set out to see what had been already done — and quickly realized how ambitious my original goal was. A number of researchers have done great work with data from this era, including researchers at the time. (You can see my rough research notes, including links to sources, here.)
Through Village Preservation’s blog, I learned about the demographic maps created by the Tenement-House Committee in 1894. I’m including a small image below, but I encourage you to click through to the Library of Congress listing to see a full-sized image — these maps are incredible.
Pierce, F. E. The Tenement-House Committee maps. S.l.: Harper & Brothers, 1894 Map. https://www.loc.gov/item/2006629793/.
What strikes me is that these map-makers were doing something we were challenged to do this week — map something that isn’t normally considered mappable. While demographics maps are common today, the crazy-quilt appearance of the lower map (showing various immigrant populations in New York) shows how ambitious a task this was at the time. The map is difficult to read at first glance, at least to my eye — our mapping conventions have evolved over time, to the point where I have built-in expectations about how a map like this “should” look. The idiom of the upper map is more familiar to me; even before studying the key, I was able to make assumptions about what it shows.
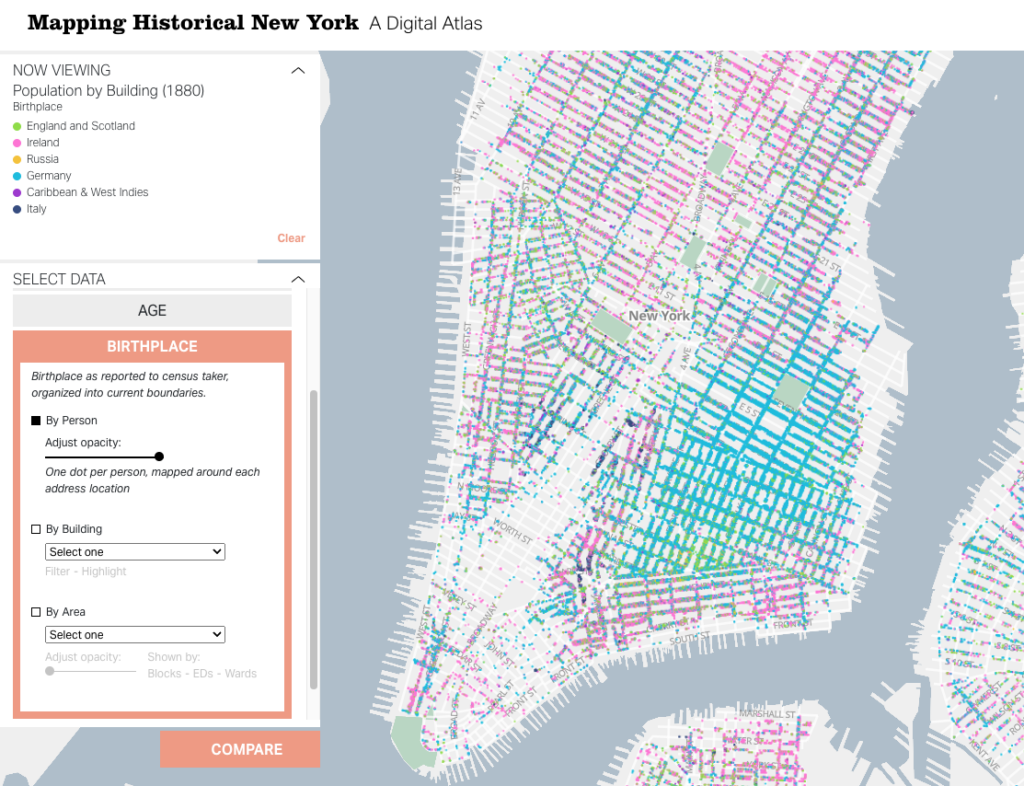
A more recent — and equally visionary — look at the same data is Columbia University’s “digital atlas,” Mapping Historical New York. The team behind this project used census records to map out demographic data at the individual and building level. So far, their data set includes records from 1850, 1880, and 1910. For each of these, you can view information related to nationality, gender, race, occupation, and age, as well as basic population density information. You can zoom out to view larger patterns, but since the map points represent individual records, you can zoom in on a block and see what types of jobs the people living there had, where they were born, and more.
Gergely Baics, Wright Kennedy, Rebecca Kobrin, Laura Kurgan, Leah Meisterlin, Dan Miller, Mae Ngai. Mapping Historical New York: A Digital Atlas. New York, NY: Columbia University. 2021.
The project includes case studies that use specific locations on the map to present a story — something I would eventually love to do with my data. However, given the complex work that’s already been done with demographics, I chose to limit my focus for this first draft to plotting locations from Wharton’s novels and Riis’ How the Other Half Lives.
Gathering Data: Challenges and Methodology
I started by reading everything I could find about locations in Wharton’s novels. Given her enduring popularity, as well as the prominence of real estate in her work, I thought that finding rough locations for many of her characters’ homes would take a Google search or two. I was wrong, of course. While you can book an Edith Wharton walking tour, these tours are mainly focused on the events of Wharton’s life and general Gilded Age sites, rather than locations in her novels. It was easy to find writing that touched on the significance of place in her work, from the hotel where Undine Spragg stays in an attempt to get “in” with high society, to Ellen Olenska’s idiosyncratic flat in a neighborhood her critics consider beneath them . But finding more detail about possible locations than is offered in the books themselves? Not easy. (Except in a few cases, which are noted in my map.)
This is where I felt my own limitations as a humanist. While I took a handful of courses in both, my undergraduate degree wasn’t in history or literature — they’re subjects I’ve continued to study in the decade and a half since I graduated, but not with academic rigor or backing. I didn’t find what I was looking for in academic databases, but I can’t say for certain that the information wasn’t there. With both the literary and historical aspects of this research, I couldn’t be certain I was asking the right questions, so I had to use a simple method of finding the answers I wanted: I went through each of my source books.
I worked with three of Wharton’s novels, each of which I’ve read within the past year:
I started by making a list of the specific locations I was hoping to find in each, as well as search terms within the novels that I thought might lead to other discoveries (e.g., “avenue,” “street,” “corner,” “house,” “home”). Since all three novels are in the public domain and available on Project Gutenberg, I was able to use ctrl+F to highlight the terms and scroll through the results. (This is a task I would like to explore again once I know more about text mining.) I started collecting my data in a spreadsheet, including:
A brief description of the locations I found
Textual evidence of the actual location. This ranged from:
Vague evidence, like “far west of Sixth Avenue” (Lily Bart’s boarding house in The House of Mirth), to
Highly specific details, like the ones that place Lawrence Selden’s bachelor apartment in the same book at 50th Between Fifth and Madison.
A relevant excerpt from the book
I did the same for Jacob Riis’s words and photos, using two sources:
Once I had my basic data, I started working to pinpoint precise locations for each place. This was fairly straightforward for Riis’ work, as he was a journalist by trade. For most of his photos and descriptions, I was able to use details in the text to easily estimate the location within a block or two.
Wharton presented a number of challenges. Most obviously, her work is fiction — so I didn’t expect an exact concurrence between her work and the New York City map. However, a few of her idiosyncrasies made my job harder:
Wharton only rarely used real places (the Academy of Music, the Metropolitan Museum of Art), but she often used buildings that are meant to be stand-ins for other, well-known buildings. For example, Undine Spragg’s hotel in The Custom of the Country is called the Stentorian. Since Wharton provides the cross streets, I know that it’s a stand-in for a real hotel called the Majestic — and her readers probably would have known that too, and understood that she was using that detail to further color Undine’s character. I have the strong suspicion that many of her other locations — especially the most ostentatious mansions — are nods at specific buildings, as well. Contemporary readers would be able to pick up these cues (and so might experts on the history of New York architecture), but it wasn’t something I could figure out in the ten hours or so I spent collecting this data.
While each of these novels is set in New York City, Wharton mainly wrote them while living in Lenox, Massachusetts. Even when she provides an exact address, it’s not clear that one should really expect that address to be accurate. For example, in The House of Mirth, Wharton provides us the exact cross streets for Lawrence Selden’s apartment building, “The Benedick.” (Another fictional but very likely-sounding location!) When Lily Bart visits, she notices every detail about her potential beau’s block — except for the fact that it contains St. Patrick’s Cathedral, if it is where Wharton says it is.
Wharton’s impressionistic mapping extended to relative locations, as well. For a while, I thought I could be clever and map the posh Fifth Avenue homes in The House of Mirth based on the movements of the characters who visit these homes. For example, characters are often described walking north or south from one house to another. I began to plot these home on a straight line — but eventually figured out Wharton had not done the same. My plan was foiled when I realized that a particular house was listed as both north and south of its neighbor.
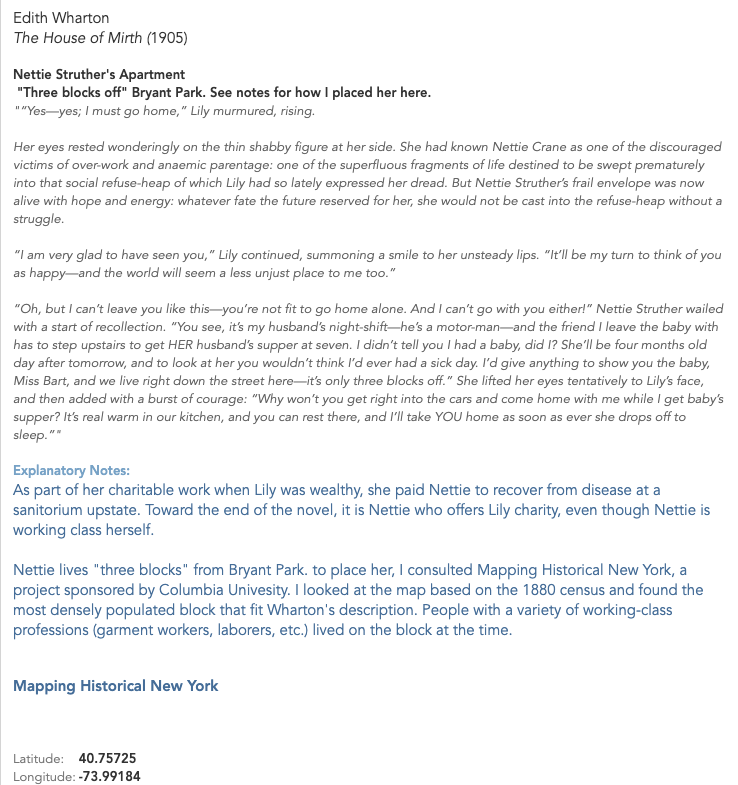
When I reached the limits of what the text could offer, my next step was to consult other sources. The one I used the most was Mapping Historical New York. When Wharton’s text offered me a general area, I used the demographics maps, as well as other historical sources, to come up with a likely location.
For example, one of the places I was most interested in locating was Lily Bart’s boarding housein The House of Mirth. This is a significant location because of what it represents: Lily’s fall into poverty after she accrues an overwhelming amount of debt and makes “bad” social choices. The boarding house is where Lily goes to live when she decides to stop accepting acquaintances’ charity; it’s also where she dies from an ambiguous overdose. When the other characters see Lily’s living situation, they are shocked and even disgusted. Here’s one reaction:
As she led the way westward past a long line of areas which, through the distortion of their paintless rails, revealed with increasing candour the disjecta membra of bygone dinners, Lily felt that Rosedale was taking contemptuous note of the neighbourhood; and before the doorstep at which she finally paused he looked up with an air of incredulous disgust.
“This isn’t the place? Some one told me you were living with Miss Farish.”
“No: I am boarding here. I have lived too long on my friends.” He continued to scan the blistered brown stone front, the windows draped with discoloured lace, and the Pompeian decoration of the muddy vestibule; then he looked back at her face and said with a visible effort: “You’ll let me come and see you some day?””
The House of Mirth, Chapter 10
Given the intensity of Rosedale’s reaction, I was extremely curious about where Lily might have lived — and how it would have compared to the living conditions of immigrants in the tenements. Fortunately, this same section of the novel offered key clues to the location. To put everything together, I consulted Mapping Historical New York, as well as information about the elevated rail line that existed at the time. I describe the process in a note on my map:
I was able to make an educated guess about the location of Lily’s apartment (as well as her chemist — see other note) based on the face that she walks there with Rosedale after meeting him as he descends from the 6th Avenue train. Based on other context, the only el stops that fit are 23rd St., 33rd St., 42nd St., or 50th St. (Others opened after the novel was written.)
Knowing that Wharton was born on 23rd and chooses to make far West 23rd the home of Madame Olenska’s artistic neighborhood in “The Age of Innocence,” I believe we can eliminate the possibility of Lily living on or near 23rd.
Demographics maps show that 50th was less densely populated further to the west, which makes it an unlikely location for a shabby boarding house. 42nd and 33rd were both dense — but given the landmarks near 42nd, and the fact that it’s closer to Bryant Park, which has been mentioned before as a place where Lily stops at this point in her life, I believe that 42nd is the most likely spot for her to run into Rosedale.
According to “Mapping Historical New York,” this block [W. 42nd between 9th and 10th] is the first one on 42nd west of 6th that has a significant number of garment workers living there in 1880; it and the blocks directly south are very densely populated, compared to the blocks to the east. 42nd St. has a large population of immigrants at that time, but from various backgrounds, whereas the streets to the south are predominantly German — something I think would have been noted if Wharton had intended it to be the case about Lily’s street.
(Interestingly, this location for Lily’s boarding house puts her only a few blocks north of one of the Jacob Riis locations in Hell’s Kitchen — but based on demographics at the time, that was a meaningful distance. The location suggests that while Lily was poor, she was still in not nearly as dire straits as the New Yorkers who lived in the tenements to the south.)
My process wasn’t quite as intense in each case, but I did try to reach this level of certainty for all my data. For this draft of the map, I eliminated locations that I couldn’t pin down within a few blocks. Once I had identified the locations that would make the final cut, I revisited the whole list on Google Maps to determine the latitude and longitude for each. You can view a copy of my dataset (as of 9/20/22) here.
Building the Map
Once I had my data, I chose to build my map in Tableau. As others have stated in their posts, it’s free for students and offers a robust toolset. I found it easy to learn, but I hit a few stumbling blocks that kept me from the vision I would ultimately like to execute.
Custom Map Image
I had originally planned to plot my coordinates on this 1879 map of New York, which I used to narrow down a few of my locations:
However, from a practical point of view, this map has a few problems. First, the perspective is skewed. The map doesn’t show a true bird’s-eye view, like we would expect from a modern map. When I attempted to overlay this image with Google Maps, I could get the contours of the Battery to match up, but Central Park wasn’t even close.
My second issue was that I didn’t trust the accuracy of the map beyond Manhattan, which would have been essential for providing the bounding latitude and longitude to map on Tableau.
I think both these issues can be resolved — but not in a couple of evenings.
Tooltip Images
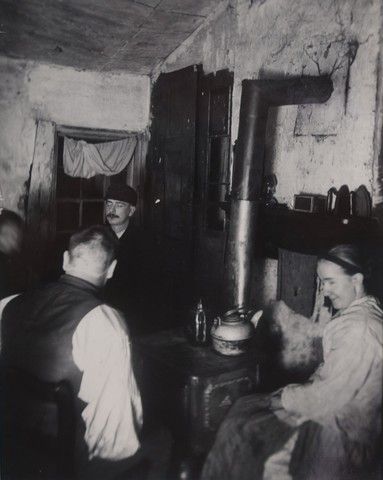
I’d originally planned to include Riis’ images as part of the tooltips for my labels; each of the points I mapped has an image associated with it.
“Children’s Playground in Poverty Gap.” 1892. Located on W. 28th between 11th and 12th.
Tableau doesn’t currently offer a built-in way to do this. Many users employ an elaborate workaround — which I will attempt in my next draft — but this seems like a real gap, as well as a barrier for Digital Humanists, students, and others, especially if the workaround solution is not scalable or easy to keep updated with new data sources.
Reflections and Next Steps
My first attempt at this project was somewhat successful — I can see the limits of my own skills, both in the humanities and in the tools I used, but I also was able to answer some of the questions I started with.
My map, with nearly all points visible. The warm colors represent locations drawn from Wharton’s novels and life, while the teal markers represent locations documented by Riis. The locations in Wharton’s work that come closest to intersecting with “the other half” are Lily Bart’s shabby boarding house (westernmost yellow marker in Hell’s Kitchen) and Ellen Olenska’s apartment in a neighborhood that we could now refer to as “gentrifying.” (One of two pink markers nestled closely together north of the Meatpacking District.) Also note how spread out the world of Wharton’s characters is compared to the densely packed New York of Riis’ tenement dwellers.
Plotting out the locations in Wharton’s and Riis’ work did give me a better sense about how the worlds they described coexisted, with Riis’ workers providing so much of the labor that Wharton’s characters would choose not to see. I was especially interested in seeing the clear lines drawn between Wharton’s “genteel poor” and the real-life tenement dwellers; even when they approach each other on the map, they don’t quite overlap.
However, the most valuable aspect of the project was the chance it gave me to reflect on larger questions, including ones we’ve touched on in class.
Namely:
How might DH tools like mapping unintentionally obfuscate the uncertainty within some works of scholarship? I know that I’ll probably end up revising some of my locations as I learn more about Gilded Age New York, and I did my best to “show my work” and be honest about how tenuous some of my conclusions are. But if this lives publicly on the web, will my caveats get lost as other people find and use my work? For example, how many walking tours would have to include my educated guess about Lily Bart’s boarding house for the location to become an established fact? Our readings this week addressed the idea of maps seeming to create truth — when Digital Humanities projects use these tools, do we run the risk of being more convincing than we intend to?
Who and what am I leaving out by focusing on Riis and Wharton, and how does this reinforce existing narratives and gaps? The whiteness of the people (fictional and real) I highlighted in this project doesn’t reflect New York today — it doesn’t even reflect Gilded Age New York. I became especially conscious of how limited my data set is when I asked my husband, who’s a historian of the Great Migration and Black urban politics, to give me a gut check on some of my methodology as I checked for information on Mapping Historical New York. Instead of answering my question, he got caught up on looking at the demographics of an area just southeast of Columbus Circle and launched into a story about how Booker T. Washington nearly got beaten up there — and how of course that made sense, given the historical context of the area. That’s a story my map wouldn’t capture, along with many others. As I expand this project, I need to add additional sources, lest I give viewers the impression that the stories I’ve chosen are representative of that era of New York as a whole.
How do our tools limit what we choose to do as humanists? When I chose to leave certain elements, like Riis’ photos, out of this draft because it was too complicated to attempt in the moment, I compromised the integrity of my original goal. I have no doubt the project would be richer with the photos included. I believe I’ll be able to include them in my next draft, but this makes me reflect on some of the debate about defining Digital Humanities and Digital Humanists — namely the perceived distance between “thinkers” and “makers.” I have more sympathy for the argument that Digital Humanists must be makers than I did before this project, though I’m not fully convinced. If those who don’t have the skills to make projects choose to rely on out-of-the-box tools that impose limits on their projects, are they just restricting their own work? Or can we aggregate all of the DH work that doesn’t get made (or executed to the fullest extent) for want of a good tool and see it as detrimental to the field as a whole?
How might these tools limit the information available to the public? If data gets left out because it’s not easily displayed, can we expect people who engage with our work to know that data exists? What assumptions might be made based on a lack of data?
I’m curious to hear others’ thoughts and critiques as I continue working on this, especially as I continue grappling with these questions.
[Updated 9/21/22 ~ 10:00 AM to add additional sources, including my dataset, and make some edits for clarity and style.]
Email us at [email protected] so we can respond to your questions and requests. Please email from your CUNY email address if possible. Or visit our help site for more information:


