Author Archives: Gabrielle Langston

Final Project Proposal – Seminar Paper

Below is a copy of the final project proposal submitted earlier in the semester, followed up some updates text based on feedback.

For the final project, I plan to write a seminar paper on subquestion “b” as indicated in the final assignment, concerning problematic legacies, and tie the concept into how the digital humanities field continues to evolve. The question states: How do digital platforms/projects/tools evidence, retain, intervene in, or speak to unequal power structures that may be legacies of colonialism? In my paper, I plan to address unequal power structures in the forms of digital tools, mapping and various articles. 

As part of my works cited, I plan to refer to the following readings and digital platforms:

Readings

  • Digital Humanities: The Expanded Field – specifically the “Big Tent” metaphor, how we address structures of power, and how we should not have a US-centric approach to the field
  • A DH That Matters – advocacy for marginalized communities, how our biases pervade technologies
  • Making a Case for the Black Digital Humanities – who’s in and who’s out, what is foundational to the digital Black humanities
  • Why Data Science Needs Feminism – the 7 principles of data feminism, specifically power
  • Visualizing Sovereignty: Cartographic Queries for the Digital Age – imagining sovereignty beyond Western cartography, the map as a “technology of possession” 
  • The September 11 Digital Archive: Saving the Histories of September 11, 2001 – catered to a sector of victim’s families (does not include people who were racially profiled as a result of the attacks)
  • Dividing Lines. Mapping platforms like Google Earth have the legacies of colonialism programmed into them – the connection between mapping and power
  • Humanities Approaches to Graphical Display – Drucker urges us to not follow along with the assumptions of data tools, we must challenge them (question their meaning)
  • Difficult Heritage and the Complexities of Indigenous Data – TBD

Digital Platforms

Next Steps

  • As I continue to further develop this paper, I plan to add more resources to cite.
  • Based on feedback:
    • Frame an argument in a way that reveals a new problem / contributes to the conversation
    • Provide an angle / opinion to the conversation, showcase voice
    • Possible thesis: we are unconsciously biased and are therefore selective of the history we choose to archive – as a result, there are voices who are left out of the conversation as we continue to make this field (and society as a whole more inclusive / welcoming / less of gatekeeping).

Praxis Mapping Assignment: NYPD Arrests and Motor Vehicle Collisions

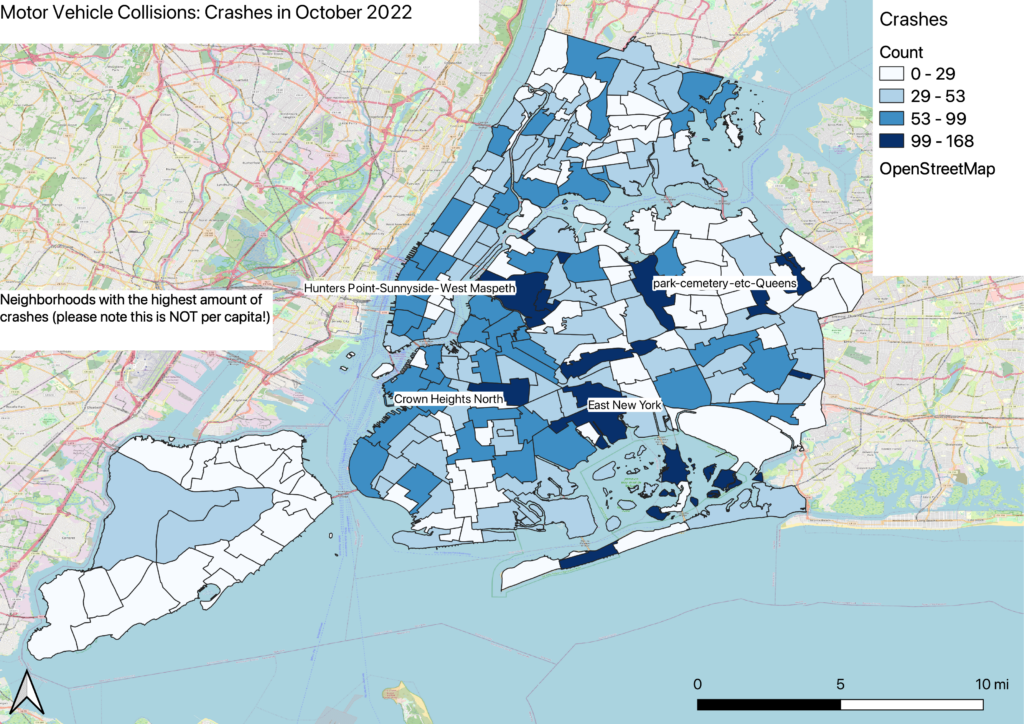
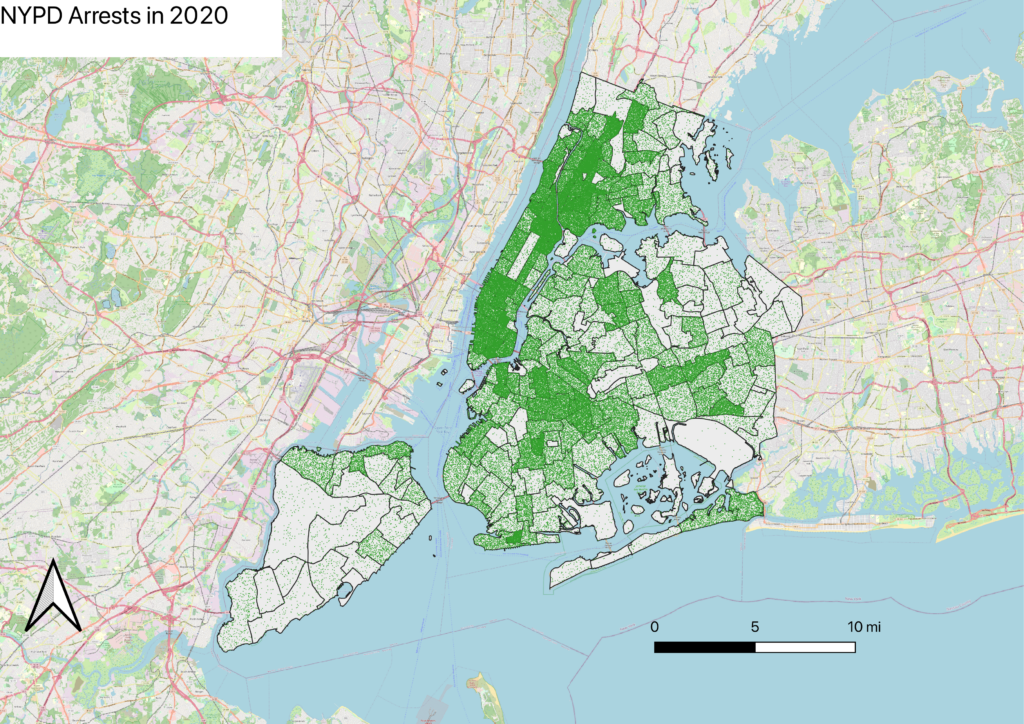
Crime and motor vehicle collisions have been hot topic issues nationwide, especially since lockdown restrictions were lifted. In light of this event, I wanted to map NYPD arrests in 2020 as well as motor vehicle collisions in October 2022. Based on the GC Digital Fellows’ Finding the Right Tools for Mapping article, I elected to use QGIS to create both maps.   

Both datasets were extracted from the NYC Open Data portal. For the NYPD arrests data, I chose to visualize 2020 arrests because I was curious to see if there was a change in the number of arrests prior to and post lockdown. As for the motor vehicle collisions, I elected to analyze the timeline of October 2022 because the dataset was too large to import into the program.

As stated in the article Finding the Right Tools for Mapping, some of the weaknesses of QGIS came to light while visualizing the data. I have a recent version of the program, and as a result, there were consistent bugs when applying multiple layers to the same map. In addition, without ArcGIS, I was unable to make the map interactive, and ultimately could not answer my initial question about the change of arrests pre and post lockdown. Lastly, I was fortunate to not have to geocode the addresses, but in the future I want to explore tools that give me that power.

Utilizing concepts from How to Lie with Maps, I chose a different map type for each dataset. For the NYPD arrests data, I chose a dot density format in order to visualize the distribution of arrests across NYC and to allow users to see which Census Tracts / neighborhoods contain the most arrests. Meanwhile, for the motor vehicle collisions data, I used a choropleth map because I wanted more control over the narrative of which neighborhoods had the most and least collisions. I quickly learned that an advantage of this technique is being able to distinguish the collisions among neighborhoods. However, since QGIS provides users with the ability to choose which scale to implement, I was able to use a scale that skewed the number of collisions — this is where Monmonier’s term of “lying with maps” comes into play.

Map of NYPD arrests in 2020 per census tract, via QGIS.
Map of motor vehicle collisions in October 2022 per census tract, via QGIS.

In the future, I would like to incorporate ArcGIS to make both maps more interactive. In addition, I would like to import more of the motor vehicle collisions data and illustrate a timeline of how the number of crashes have changed over the past decade.

Week 1: Expressions of Digital Humanities

Through our class discussion and readings, it is enlightening to learn how the digital humanities field has evolved over the years. Furthermore, it seems that the field has faced similar setbacks and reckonings with regards to defining the field, who is part of the community and how changes in society can impact the field.

The sites and projects we’ve explored embody the concepts discussed in the readings. Whether it’s access to prior online publications, or online archives of history bringing hidden stories to life through texts, maps and images, each site captures the definitions of digital humanities discussed throughout the readings and in our last class. In addition, the sites represent the complexity of digital humanities and how the field is not a “one-size fits all.” 

For instance, in The Early Caribbean Digital Archive and The Colored Conventions Project, the scholars have compiled powerful digital tools that not only bring attention to social issues, but serve a purpose to educate audiences on our painful history, and encourage us to think about the ways we teach history to future generations. This ideology is also referenced in A DH That Matters in the context of addressing problems we currently face, “…  we must interrogate our work to ensure that we are not ourselves complicit in the neoliberal practice of naming problems in order to evade their resolution.” 

Meanwhile, in Reviews in Digital Humanities, Drs. Jennifer Guiliano and Roopika Risam have designed an open access archive of peer-reviewed journals, providing those who wish to enter digital humanities a deep dive of the current phenomena in the field. Such sites are crucial as they begin to provide accessibility (excluding those who don’t have access to technology or computers), but simultaneously serve as a means of transparency of which fields of study are featured on the site, bringing back the questions of who is currently part of the digital humanities community? And who is being excluded as a result?