
For my Data Visualization Praxis my primary goal was to gain awareness of the Tableau platform. Below is an outline of my process including the challenges and understandings that emerged.
WHAT TO VISUALIZE
Given that I went in primarily concerned with the technology not the content, it was a bit difficult to narrow down or understand what kind of data would be best to visualize. I found myself ambivalent about most of the data sets I ran across and even tested out a few to see if they might sing to me once loaded in the program. They did not. Without a personal connection or familiarity with the questions the data inherently touched on, I couldn’t formulate a need to visualize it. I am studying race and politics in antebellum US at the Grad Center this semester as well, and my first thought was to visualize key events in the evolution of the various iterations of the anti-slavery movement or the birth and evolution of the Republican Party. In the end, I didn’t feel I had enough data to map the central ideas properly. As a bit of a quirky middle ground, I chose to parse US AID* funding between 1945 and 2021, available on the US Aid website. The data set inherently incorporates US and world history which I find very engaging.
HOW TO VISUALIZE
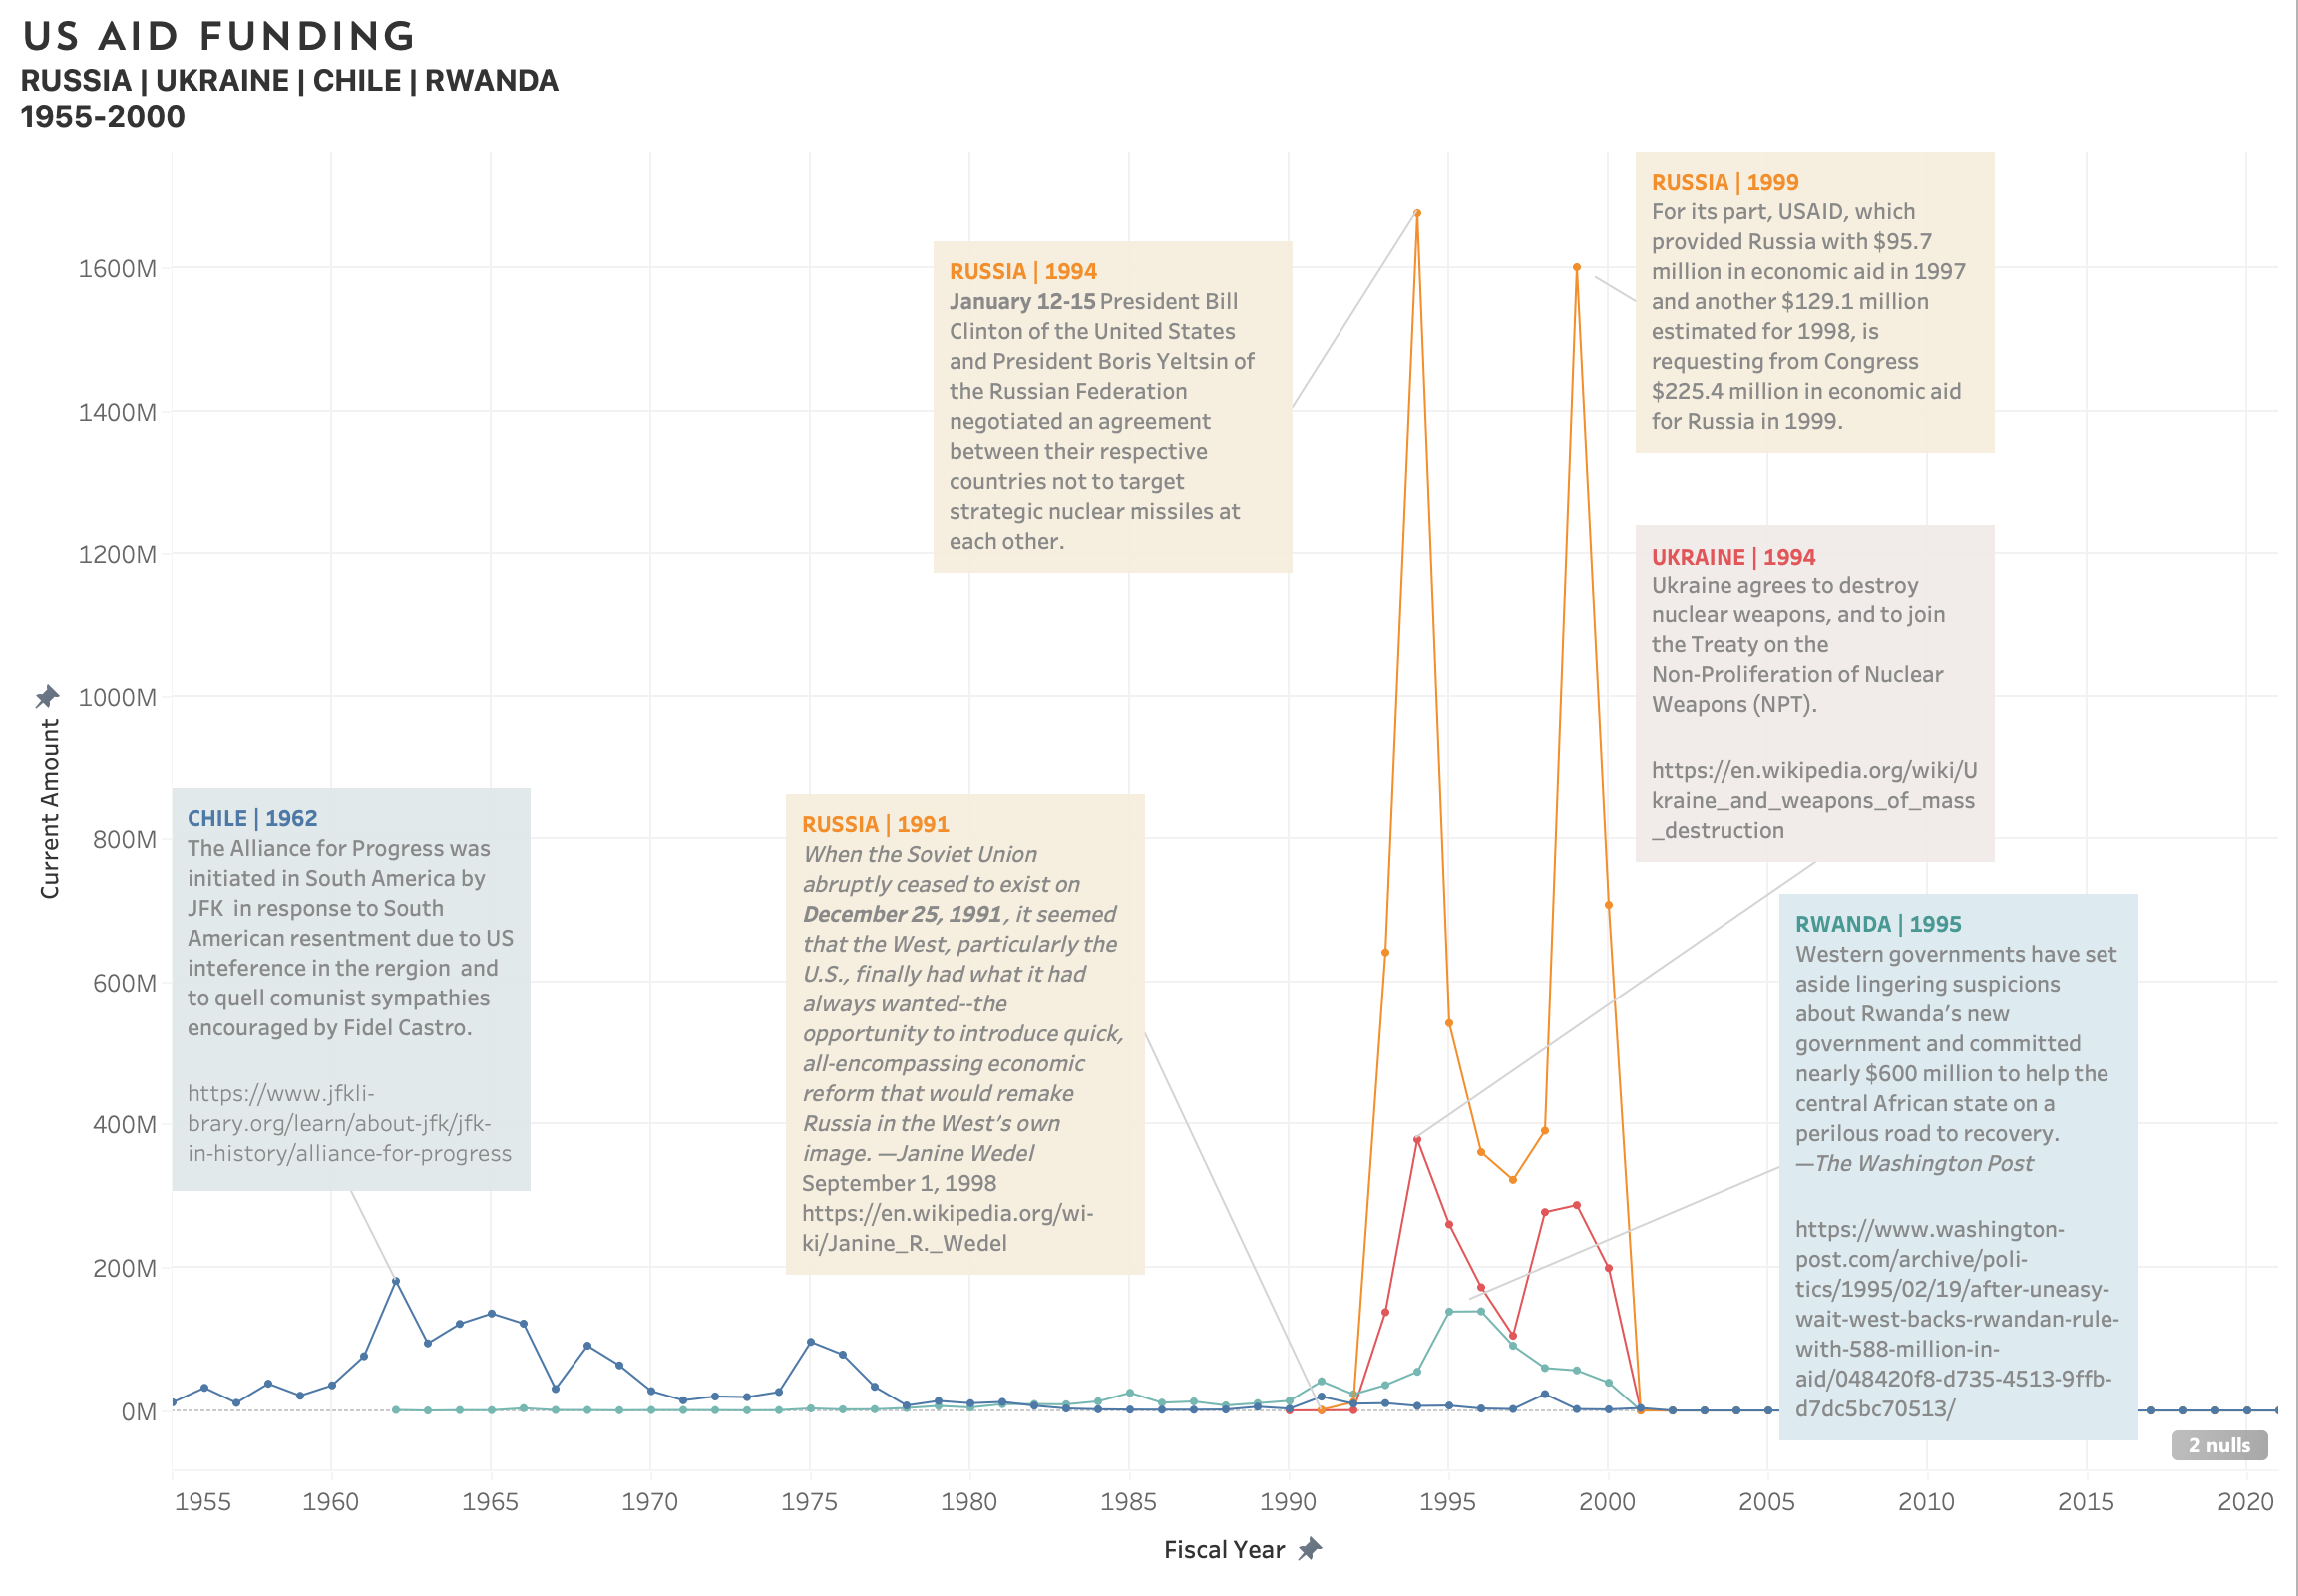
The data set is quite large (funding from 1945-2020 to almost every nation in the world), and I knew that including all aid over that vast period of time would be overwhelming I knew I wanted to compare and contrast a few nations, but which ones? Ukraine and Russia came to mind because of current news. I included Rwanda, because I assumed there’d be data around the civil war. And Chile. Why Chile? I wanted to hop over to another part of the world, I knew the US had interfered quite heavily in the region, and, well, my husband’s family is from Chile. I chose a color coded line graph, because I wanted to compare and contrast the rise and fall of aid to these. US Aid lists its funding in both current currency values and set as a constant value. I chose to show dollar amounts in current values to make it more relatable, but ideally I would be able to use Tableau well enough to allow for a reveal of the secondary amount for any given data point.
When I noticed that not much money was given to any of these nations until the 50’s, I shorted the displayed timeframe. Unfortunately, the data between 2000-2020 will not load, despite it being included in the data set. This has been particularly frustrating, because the data during that period is sure to reveal heightened activities by the department and reflect global conflicts and major shifts in US foreign policy.
NOW WHAT
After plotting the points it was interesting to the emergence of peak years of funding —making me curious about what events, political environments, and policies impacted the amount of aid. This, for me, is where the fun really started. I researched each nation and was able to determine various events that may have impacted the time and amount of funding. I do recognize the limitations somewhat cursory research, and don’t present it in itself as any form of deep scholarship well rounded theory. In fact, more questions about policy, US and International geopolitical strategies before and after the graphed points, and the impact of the aid quickly arose. The sources I used to look into each point included the JFK presidential memos housed at the presidential Library, government websites, political science think tanks, and even wikipedia—all presenting information in their own formats and from various points of view. From reading the notes taken when JFK spoke with the Rodríguez, then president of Chile, to dry government reports and summaries of aid and newspaper articles adding flavor—they all gave different impressions of the events at hand.
RAISE FROM THE DEAD
Being inside of a Data set is a charged experience. There are many perspectives and stories that are hidden in the points, and I found a strong desire to reanimate the numbers with the information about the events and motivations behind them— to add water to the dehydrated goods. With this in mind, I decided to annotate all of the peaks with a quick note regarding what I had found in my research. I did this knowing that what I chose to include in the annotations would be incomplete—but I viewed this step as an invitation to the audience to question, amend, and correct the theories I posit related to the peak funding years.
——————
*US AID MISSION STATEMENT:
“On behalf of the American people, we promote and demonstrate democratic values abroad, and advance a free, peaceful, and prosperous world. In support of America’s foreign policy, the U.S. Agency for International Development leads the U.S. Government’s international development and disaster assistance through partnerships and investments that save lives, reduce poverty, strengthen democratic governance, and help people emerge from humanitarian crises and progress beyond assistance.”

This entry is licensed under a Creative Commons Attribution-NonCommercial-ShareAlike 4.0 International license.