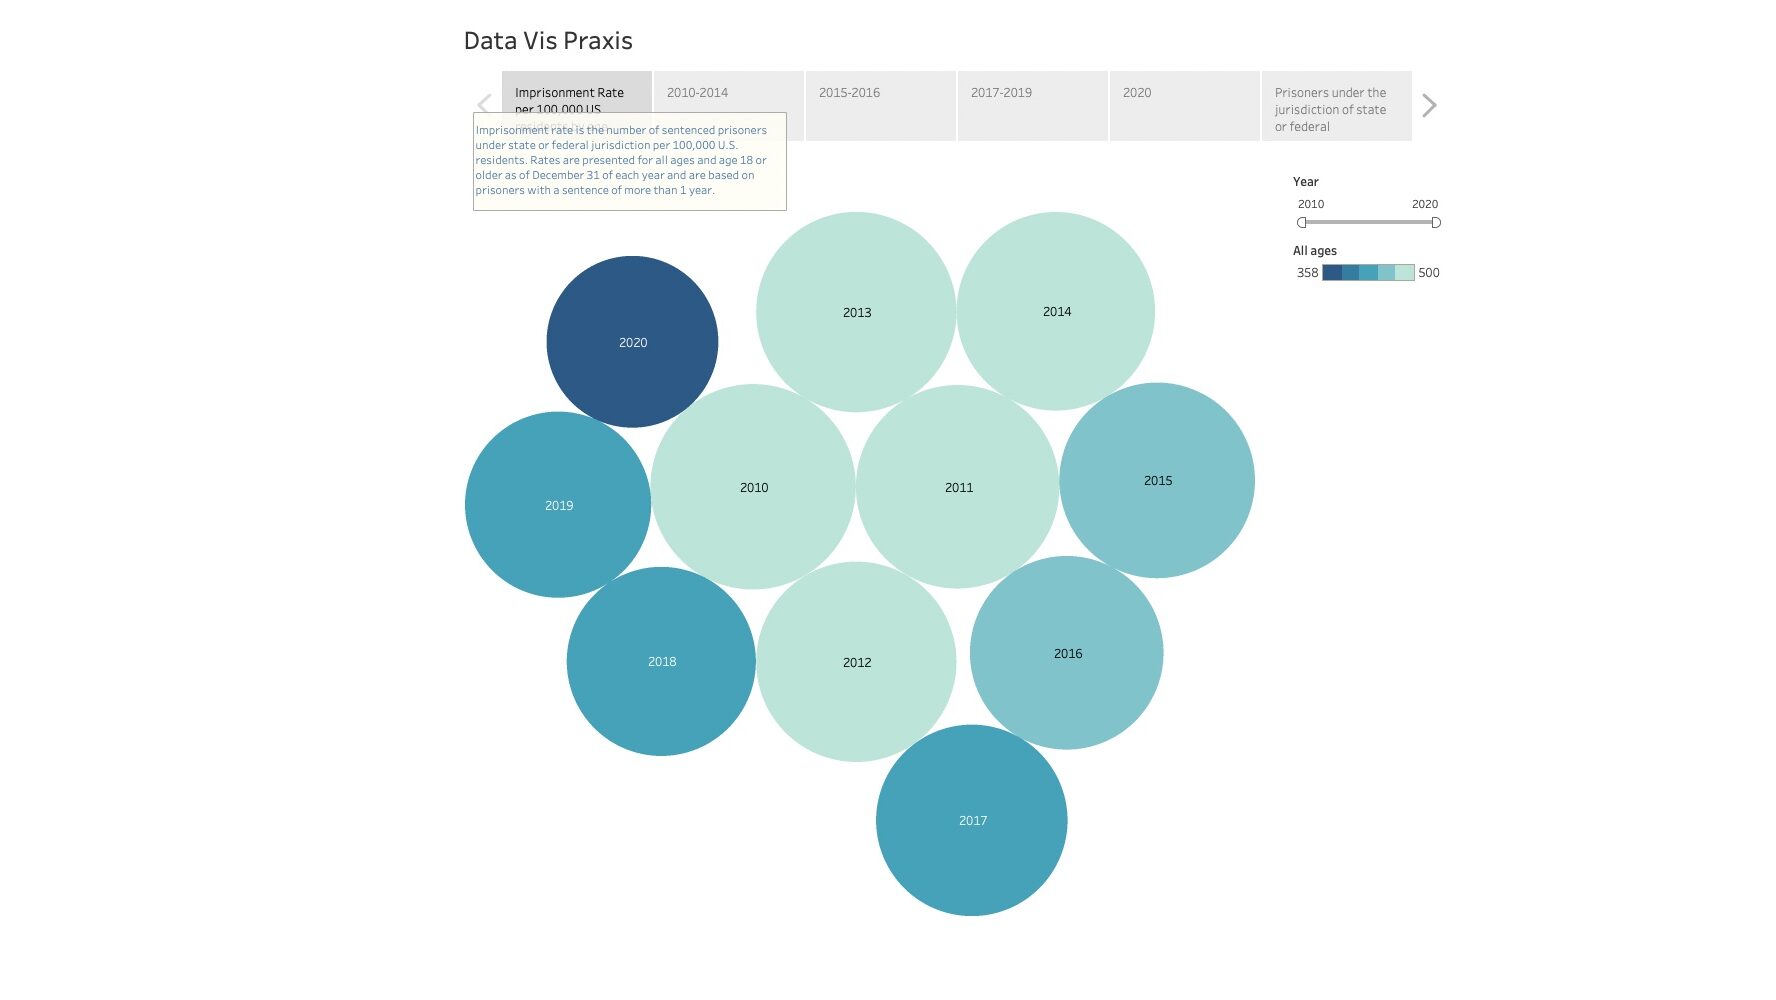
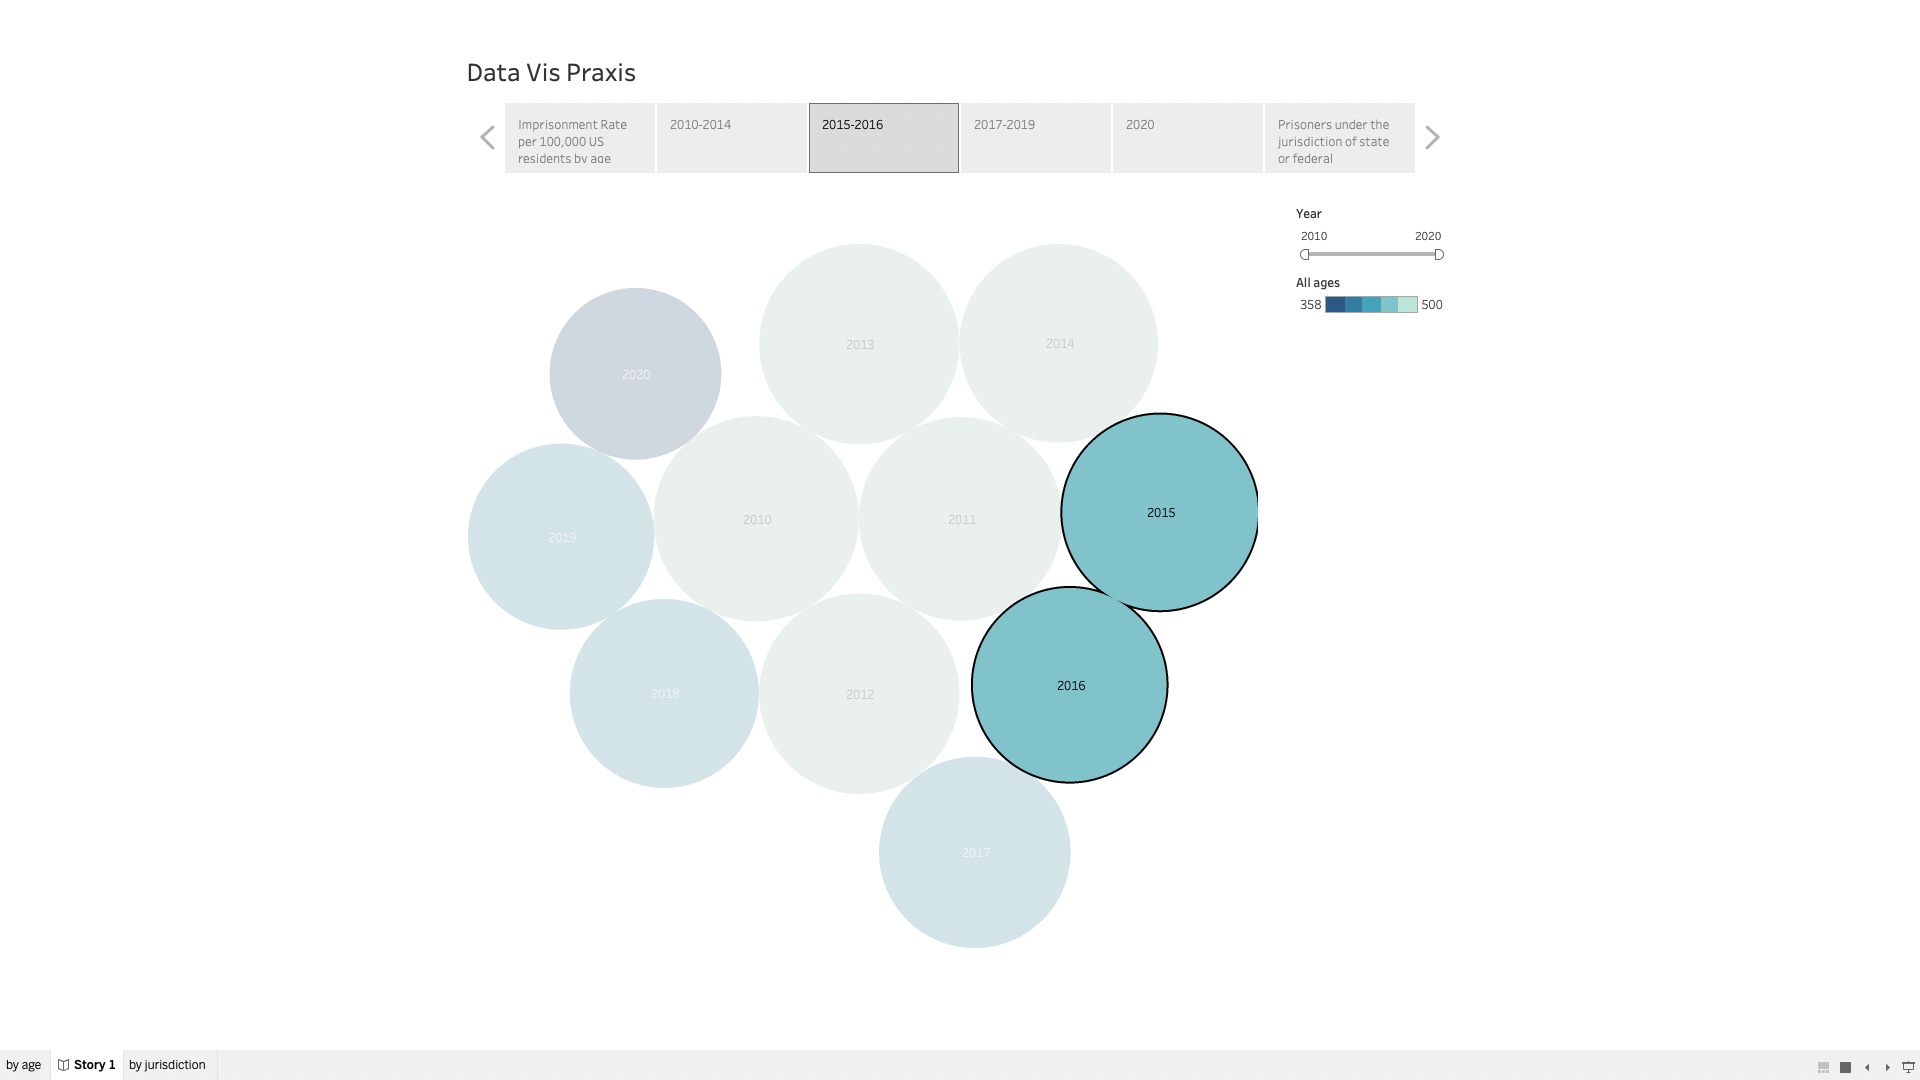
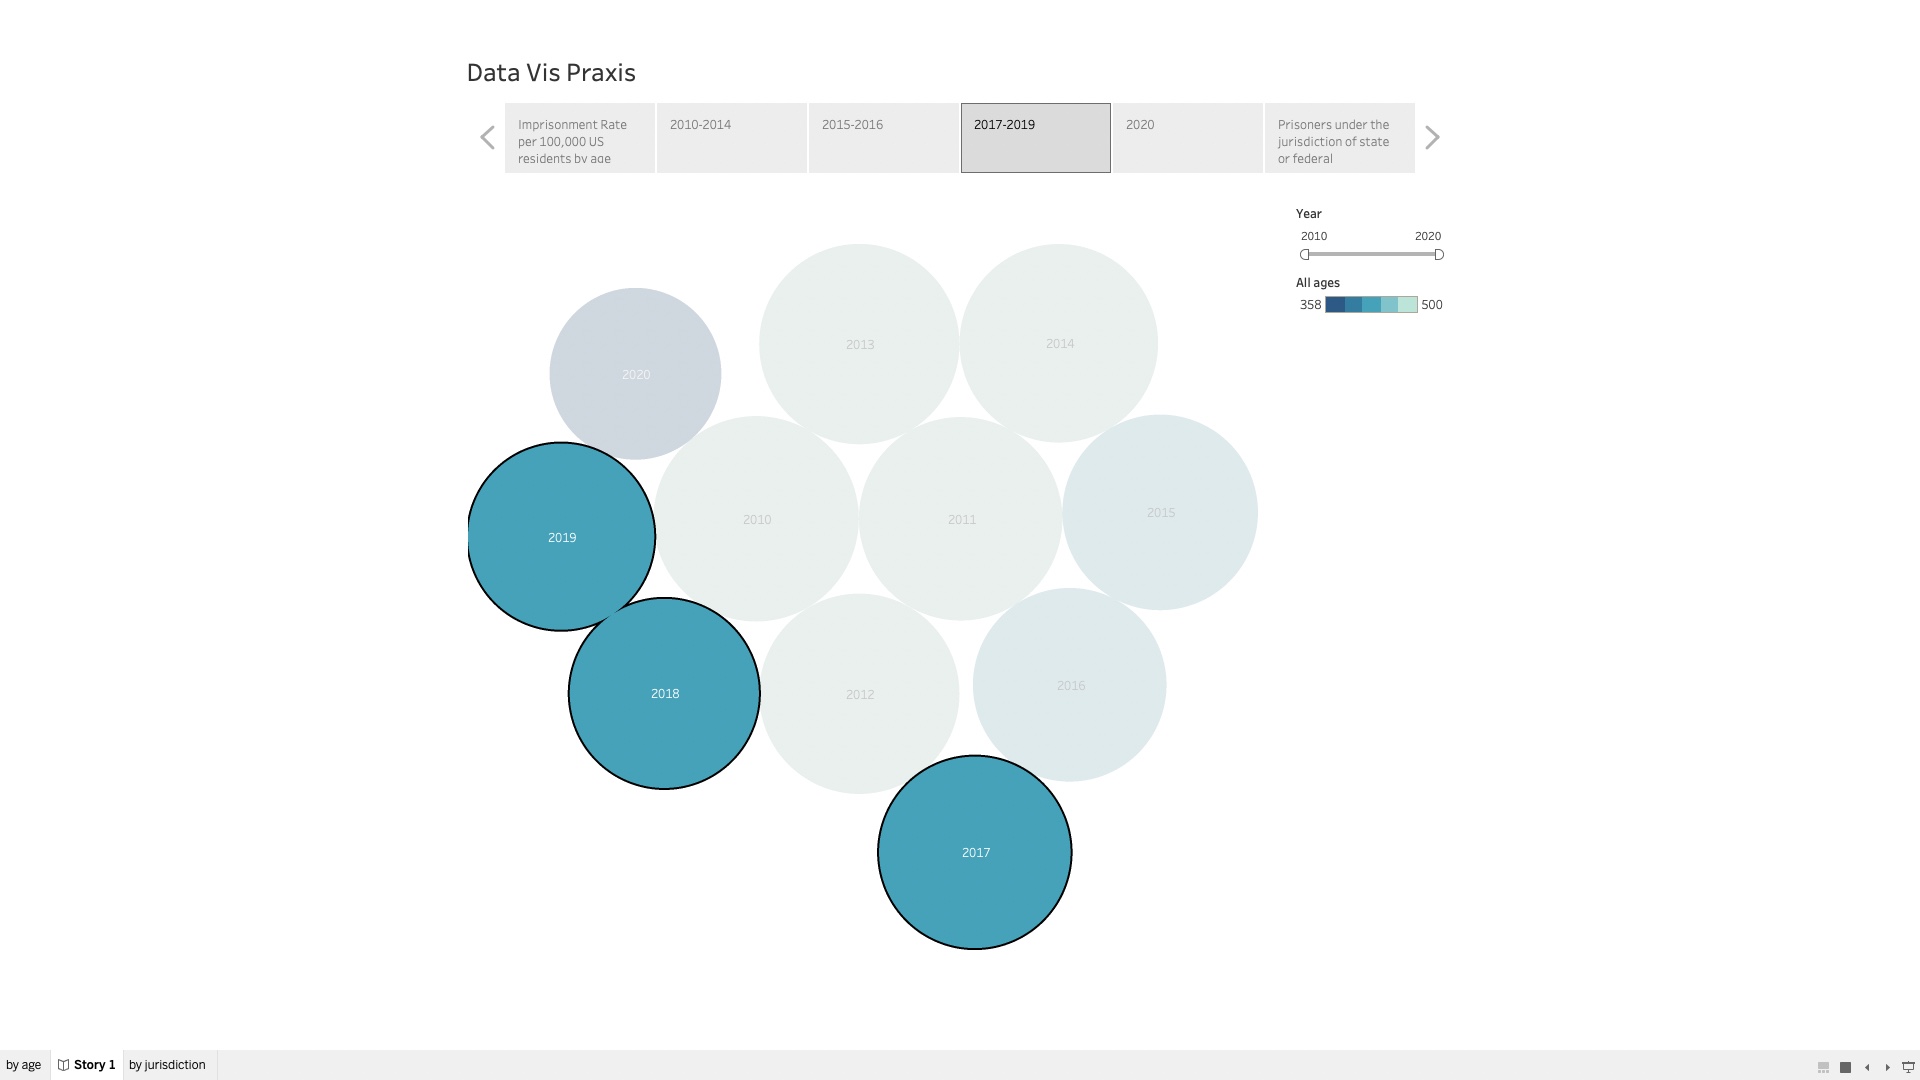
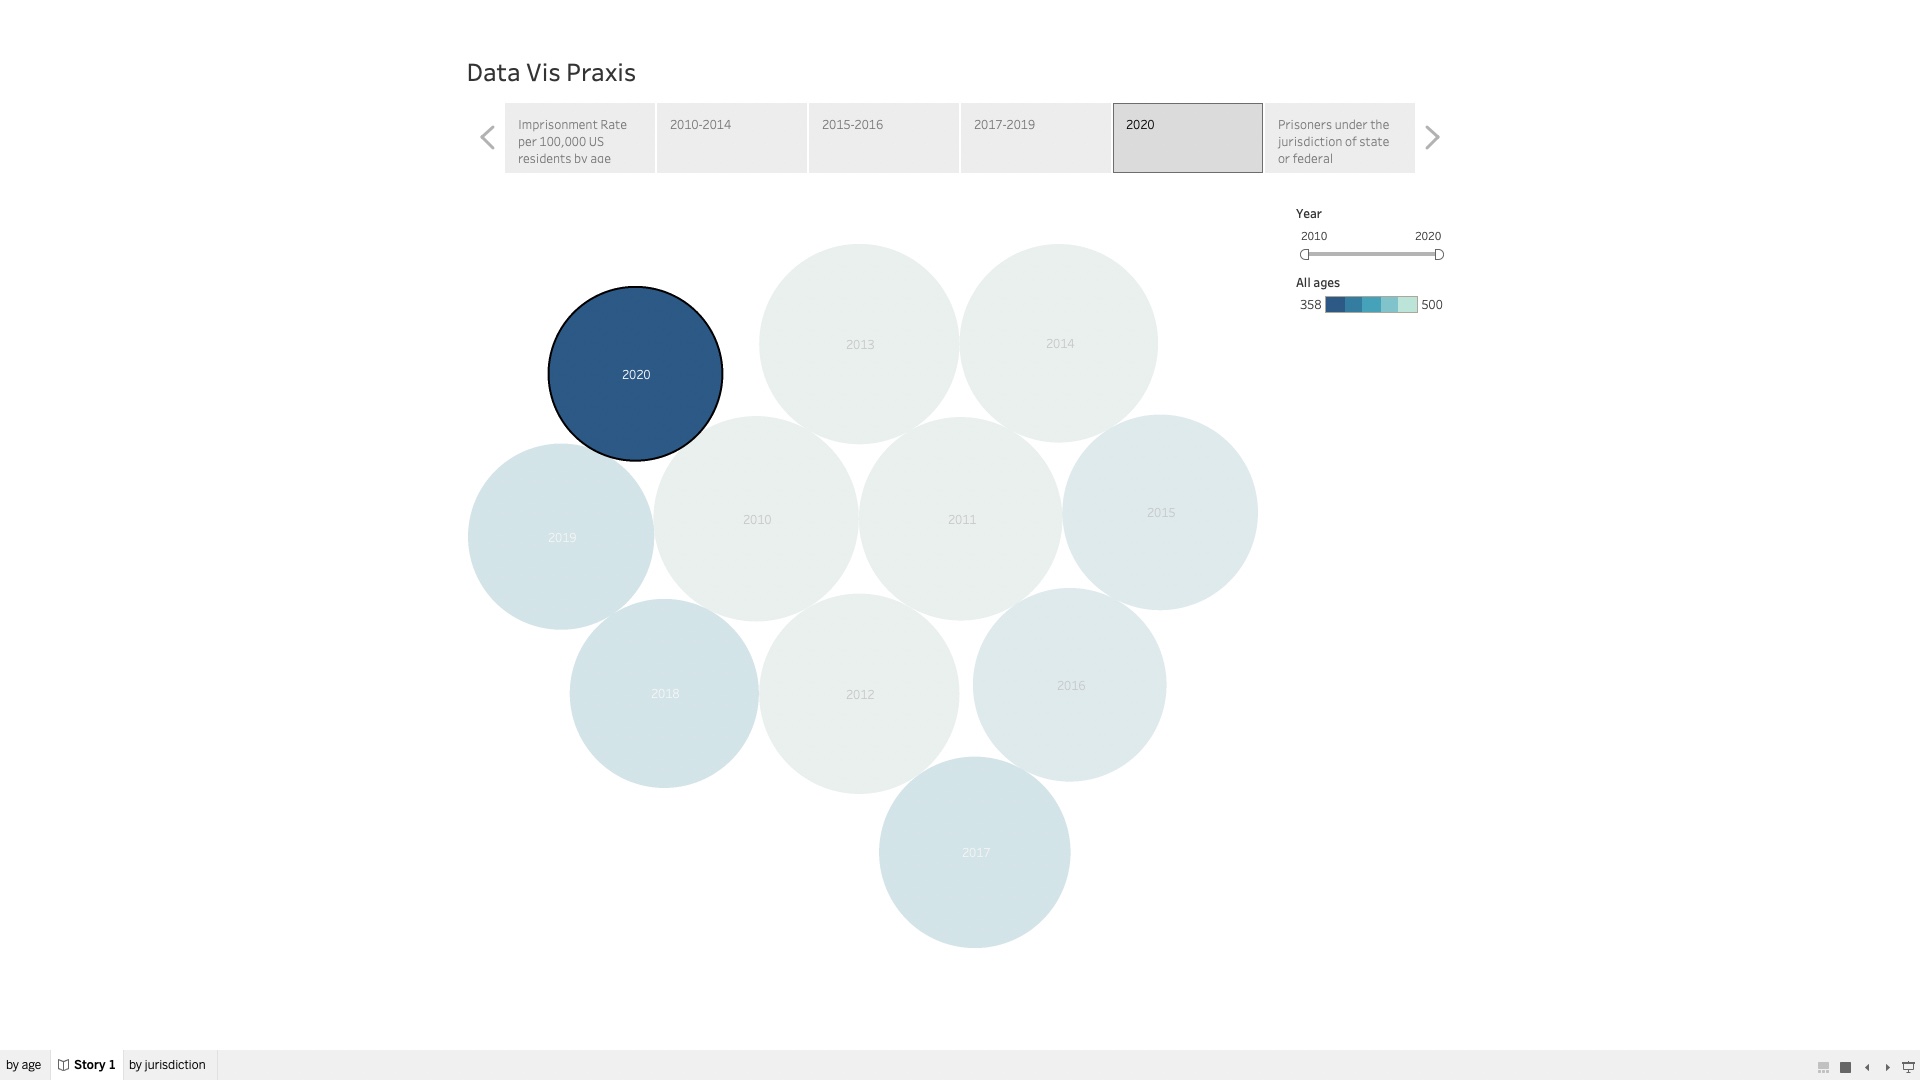
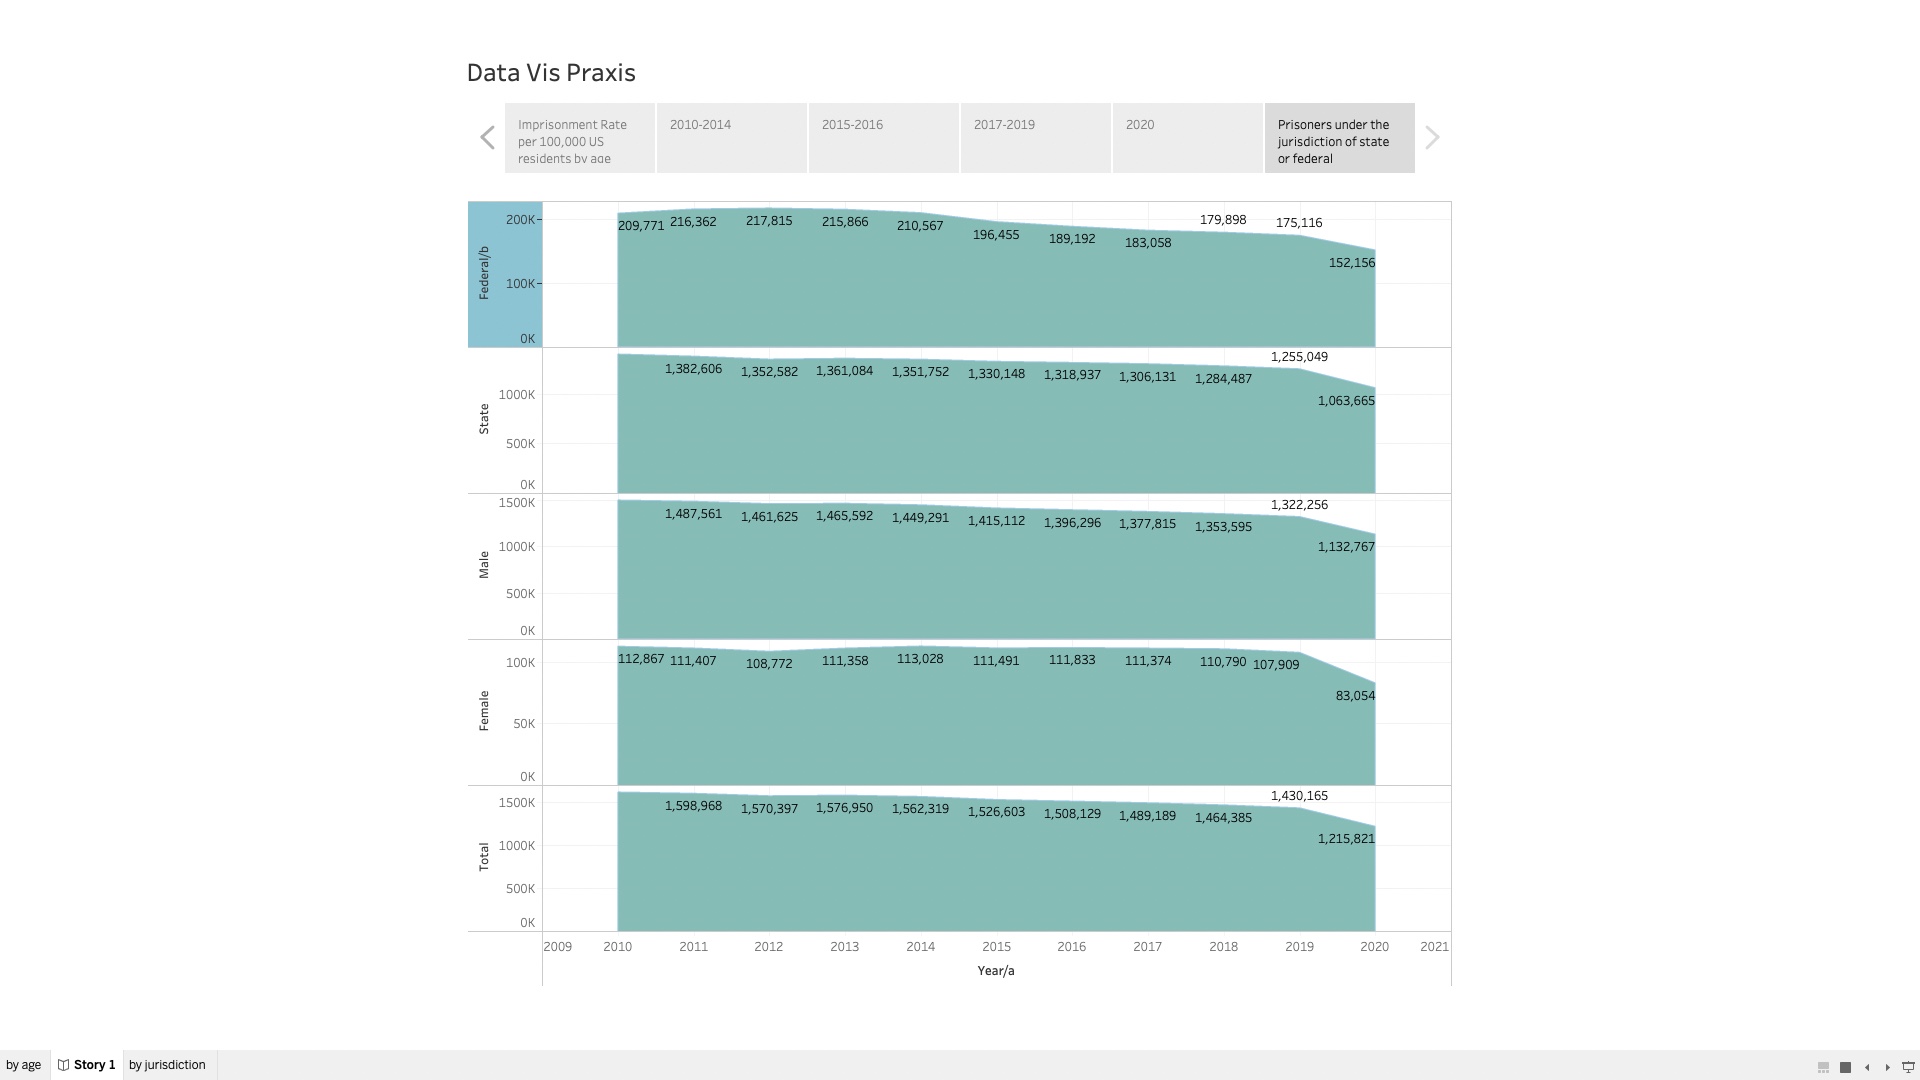
FYI—-I created a Tableau Public and when I tried to share it was not sharing both sheets so I ended up after many hours saving it to the Tableau Desktop. I included screenshots and if I can figure out how to share via a link or can share on the screen in class, I will. Until then….
To complete this assignment, I pulled some general data sets from the same area of interest- the profits of the prison industry. I have read a lot this past week on the prison industry, spurred by my original curiosity of cost of telephone and video visits in correctional facilities. This is a topic that I am going to continue to research and acquire data about the real criminal of society- corporate and government greed.
This was my first Tableau experience and it took me a bit to get the hang of it (still getting the hang of it) but I really enjoyed using it to have the opportunity to display data in a vibrant way. I did sign up for the student free account but still working through figuring how it works and if it pairs with Tableau Public.
I created a viz using data from the Bureau of Justice Statistics, National Prisoner Statistics, 2010- 2020 for Prisoners under the jurisdiction of state or federal correctional authorities, by jurisdiction and sex, 2010-2020.
The data source for Imprisonment rate per 100,000 U.S. residents, by age, 2010-2020 was also Bureau of Justice Statistics, National Prisoner Statistics, 2010-2020; and U.S. Census Bureau, postcensal resident population estimates for January 1 of the following calendar year.
