
https://public.tableau.com/app/profile/colin.geraghty
Data and Visualization
I singled in on the sterilization aspect of Eugenics for data visualization. I found a study done in the American Journal of Public Health (AJPH) with the objective of comparing population-based sterilization rates between Latinas/os and non-Latinas/os sterilized under California’s eugenics law. I purposely did not look at AJPH’s conclusions. Instead, I transferred their data into Excel and then to Tableau to analyze it.
A total of 17,362 individuals were recommended for sterilization from, as they were then known, “Feebleminded Homes” and “Homes for the Mentally ill” from 1920 to 1945 in California. AJPH broke this down under the headings of `Non-Spanish Surnames’ and ‘Spanish Surnames’ and then ‘Year recommended for sterilization’, ‘Gender’, and ‘Age’.
Year recommended for sterilization
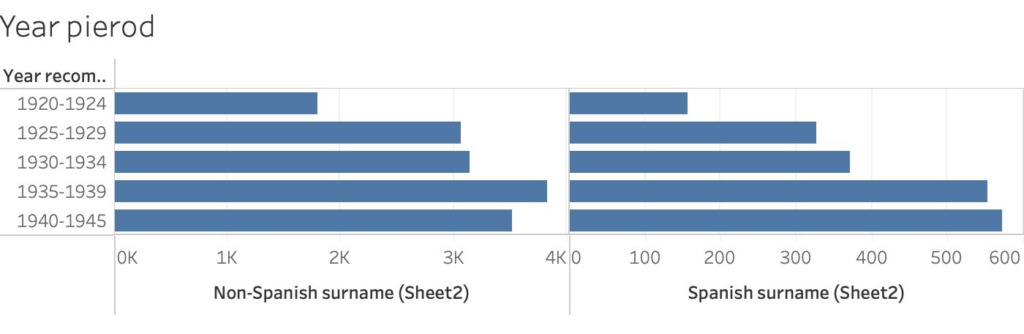
This shows sterilization laws were disproportionately applied to Latina/o patients later in the time frame. Yet, the differences are not much, and more data is needed to establish a clear bias. For instance, I think the location of these institutions could play a factor. It could be that they were in predominately non-Latina/o areas or with an increase of immigrants.
Gender
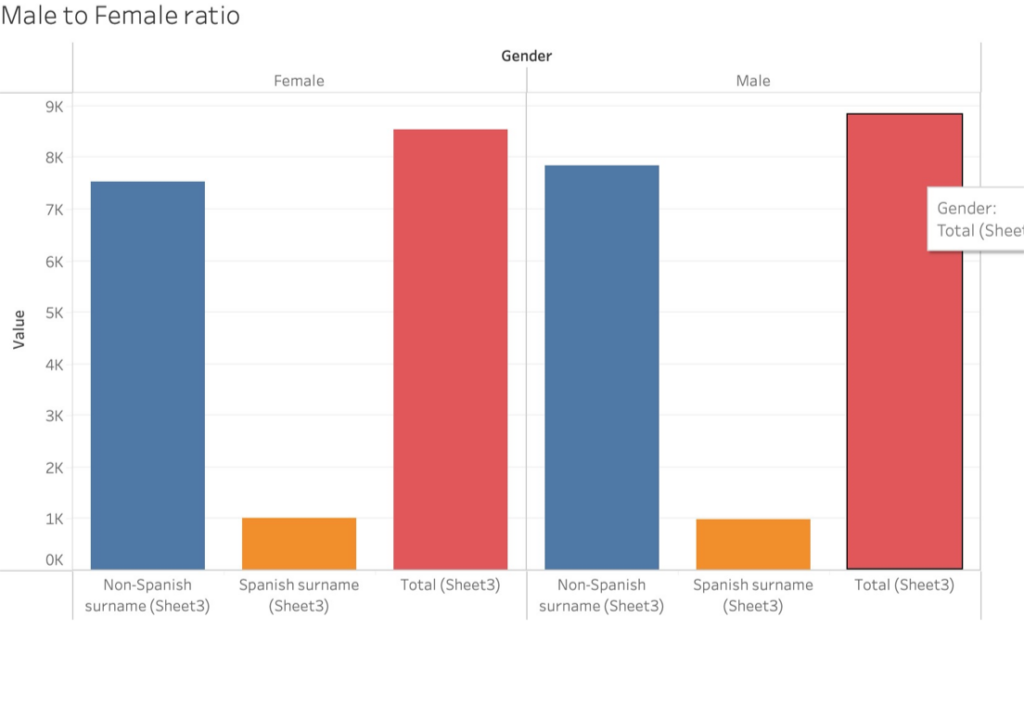
Like with ‘Year recommended for sterilization,’ the Gender visualization does not show sterilization laws were disproportionately applied to Latina/o. What would be interesting to find out is if the above table correlates to California’s entire population during the time frame. Or other factors like, of the males sterilized, what proportion of Spanish surnamed to non-Spanish surnamed patients were committed because they were convicted of a crime.
Age
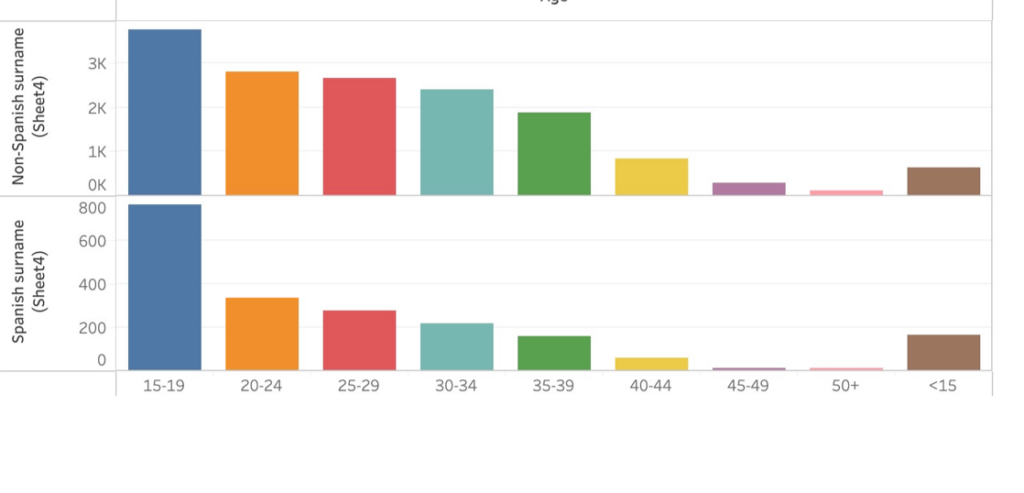
Age is where there is clear evidence that sterilization laws were disproportionately applied to Latina/o patients. The bar chart above shows that California sterilized Spanish surnamed patients younger than Non-Spanish surnamed ones. It would be interesting to know, of the under fifteen-year-olds and fifteen to nineteen-year-olds, how many were male and female. I suspect that there were more Spanish surnamed girls than boys sterilized. Although both sexes were sterilized equally overall, there’s something profoundly sad about it being done to a girl who hadn’t reached adulthood.
Source-Nicole L. Novak, Natalie Lira, Kate E. O’Connor, Siobán D. Harlow, Sharon L. R. Kardia, and Alexandra Minna Stern, 2018:
Disproportionate Sterilization of Latinos Under California’s Eugenic Sterilization Program, 1920–1945
American Journal of Public Health 108, 611_613,https://doi.org/10.2105/AJPH.2018.304369

This entry is licensed under a Creative Commons Attribution-NonCommercial-ShareAlike 4.0 International license.