
Since Python is such a useful programming language for data wrangling, how can I use it to map data without exporting data frames to a third-party tool like Tableau? This is the question I had back in 2020 while I was working with the London crime dataset. After googling for a while, I found folium, a python based library that uses Leaflet.js for mapping. The main concept behind folium is that one will manipulate the data in python and then visualize the map with Leaftlet.js through folium.
The project was firstly intended to find the safest boroughs in London based on the reported crime data. Then cluster the neighborhoods of the safest borough based on the crime data and amenities closer. This will help users to find the best place to live within the safest borough. I am writing this article to explain the workflow of the project in detail. Since this is a blog article I have limited time and space to achieve my objective. I will try to deliver the fundamentals. The development environment I have used for this project is google colab.
Dataset Description:
I pulled the London crime dataset from Kaggle which consists of 13M rows of criminal reports by month, London boroughs, and crime category from 2008 to 2016. The dataset was created by Jacob Boysen by pulling .txt files from the Google Cloud Platform and then converted to .csv.
Working Process:
Once a dataset has been acquired, the first thing I did loading it into a dataframe for pre-processing. I used pandas, a python library for data wrangling for this purpose. Pandas can be used with python script by importing with the following command.
import pandas as pd
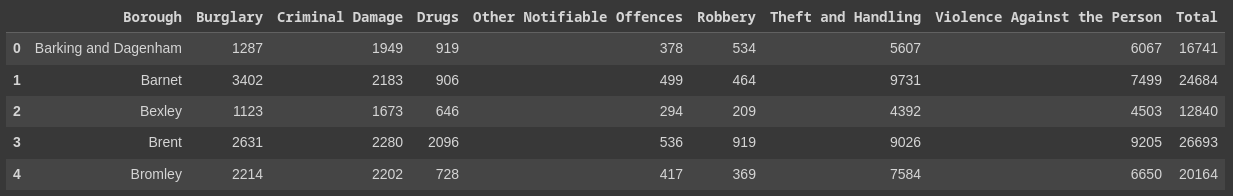
A .csv file can be imported into dataframe with read_csv function. Loaded data can be viewed with df.head() command. This will return the first 5 rows of the dataframe.

As you can see the original dataset contained null values, which required some preprocessing. I dropped the null values with dropna(), and added the total number of crimes per major_category per borough, and total crimes per borough. Finally dropped the rest of the columns to create a new dataframe. The processed dataframe I got is given below.
Next, I did some plotting to find out the safest district. Below were the 5 safest districts in terms of total crime. Kingston upon Thames was the safest borough according to the plot.

At this point, I required all the neighborhoods of Kingston upon Thames. I used Wikipedia for this. Then I used a geocoder to get the coordinates of the neighborhoods. The dataframe with coordinates is given below.

Then I used this dataframe to map the neighborhoods with folium.

To explore the neighborhoods, I used foursquare API to find out the most common venues around the neighborhoods. Below was the result.

Then I used the k-means clustering algorithm to cluster the neighborhoods into 5 clusters based on crime data and amenities around. Cluster 0 represents the best to live in Kingston upon Thames borough. After the clustering, I again mapped the results with folium.

Google colab link for the project: https://colab.research.google.com/drive/1os-lD5GFDTTP9HJ7sDok-2hCELHgyg4M?usp=sharing
I will update this project soon. Meanwhile, if you have any questions or suggestions regarding the project, I welcome your thoughts!!!

This entry is licensed under a Creative Commons Attribution-NonCommercial-ShareAlike 4.0 International license.